Sponge (SPONGE/USD) Regroups Around $0.00017
Estimated Reading Time: 2 minutes
Don’t invest unless you’re prepared to lose all the money you invest. This is a high-risk investment and you are unlikely to be protected if something goes wrong. Take 2 minutes to learn more
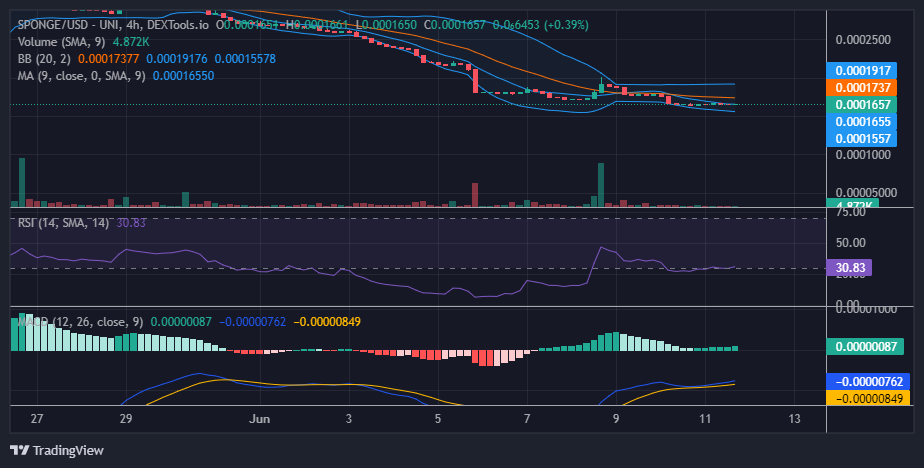
The Sponge bull market encountered a strong barrier at the $0.0001917 price level, and after the price was rejected around the resistance level, it fell back to the $0.00017 support price level. The price is expected to rally from this level as the support level appears to be very strong.
Key Levels
- Resistance: $0.0004, $0.0045, and $0.0005.
- Support: $0.00015, $0.00014, and $0.00013.
Sponge (SPONGE/USD) Price Analysis: The Indicators’ Point of View
The three indicators used for the analysis portray indecision as the market fell back to the support level. In the Relative Strength Index (RSI), the Sponge market hovers at the threshold of the oversold region. Hopefully, as the market starts fully this week, it will break the resistance. The Moving Average Convergence and Divergence (MACD) indicator now has bullish crossover below the zero level. This is an indication that the direction of the market is now facing the upside.

SPONGE/USD Short-Term Outlook: 1-Hour Chart
From the 1-hour trading session, we can see that the price consolidation trend might be reaching its climax. As the market hovers around the $0.000166 price level, it strengthens it as a support level, and with the increase in the buying momentum, the Relative Strength Index measures 43. Hopefully, in the next daily trading session, we should see a price breakout.
The Sponge airdrop is still ongoing; take advantage of this opportunity.
Hello #SPONGERS!!!👋🧽
Join the $SPONGE #Airdrop today by completing the tasks outlined in our #Discord!🚀💰
Make sure to check all the rules in the airdrop-signup channel!👀📋https://t.co/lzRhjW4WBj pic.twitter.com/KyxVH0z9xC
— $SPONGE (@spongeoneth) June 10, 2023
Invest in the hottest and best meme coin. Buy Sponge ($SPONGE) today!