Chainlink Recovers as Bulls Buy the Dips above $7.19
Estimated Reading Time: 2 minutes
Don’t invest unless you’re prepared to lose all the money you invest. This is a high-risk investment and you are unlikely to be protected if something goes wrong. Take 2 minutes to learn more

Chainlink (LINK) Long-Term Analysis: Bearish
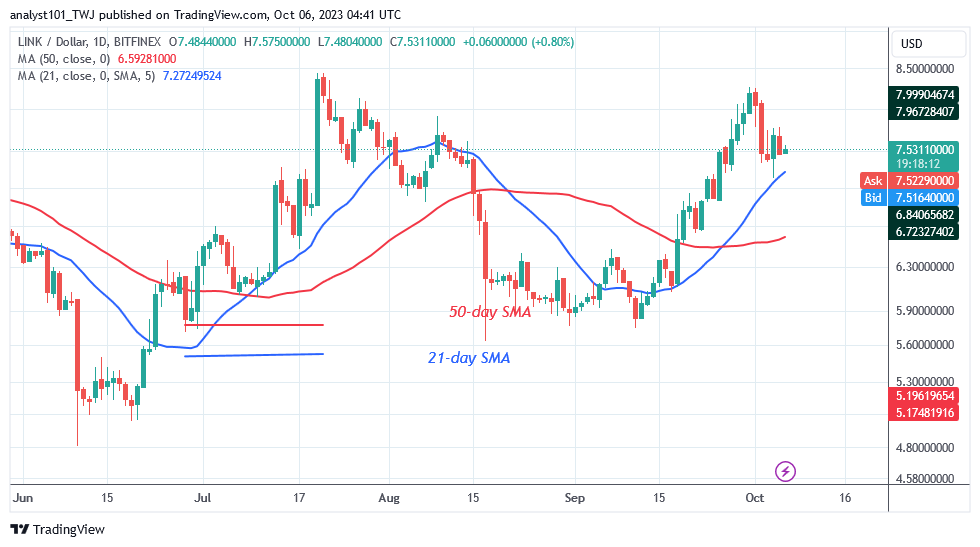
The price of Chainlink (LINK) has been retracing after it tested the overbought area as bulls bought the dips above $7.19 .The crypto asset has retraced today above the moving average lines, reaching a low of $7.21. The altcoin rose to a high of $8.44 on July 20 before falling below the moving average lines. The bearish trend continued down to $5.63.
The price of LINK is currently holding above the moving average lines. On the plus side, the market will increase further to a high of $9.79 if the altcoin rises and breaches the resistance level. The altcoin will drop to its previous low of $5.74 if the price drops below the moving average. The selling pressure has subsided as long as the altcoin is above the moving average.
Technical indicators:
Major Resistance Levels – $8.00, $10.00, $12.00
Major Support Levels – $6.00, $4.00, $2.00
Chainlink (LINK) Indicator Analysis
The price of Chainlink had been increasing so long as the price bars were above the moving average lines. If the moving average lines are broken below them, the fall will resume. The cryptocurrency has crossed in a favorable direction. The 21-day SMA crossing above the 50-day SMA serves as a signal for the bullish trend
What Is the Next Direction for Chainlink (LINK)?
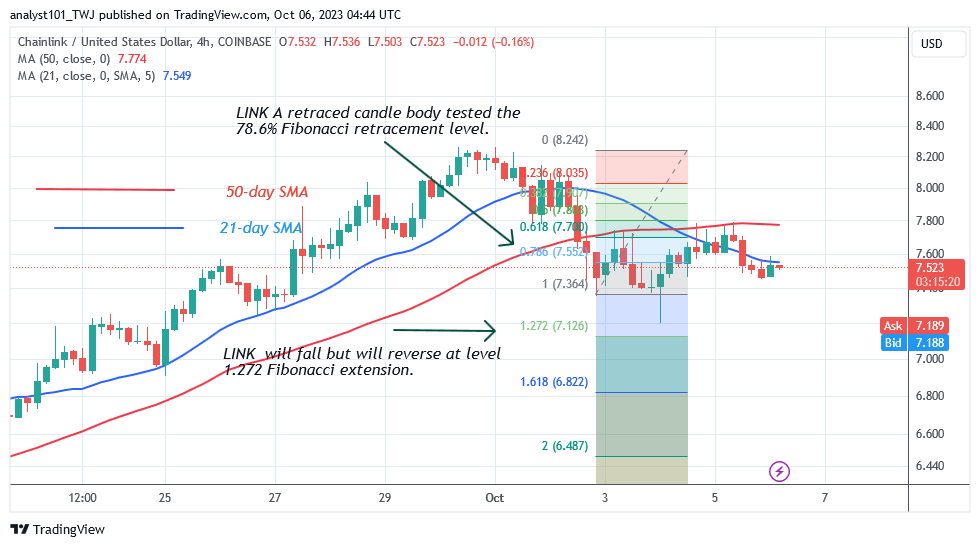
Chainlink is declining below the moving average lines on the 4-hour Chart as bulls buy the dips above $7.19. The price signal indicates that the selling pressure has subsided. The LINK price will decline but will turn around at the Fibonacci extension level of 1.272, or $7.12. According to price movement, the altcoin dropped to a low of $7.19 on October 4 as bulls purchased dips.
You can purchase crypto coins here. Buy LBLOCK
Note: Cryptosignals.org is not a financial advisor. Do your research before investing your funds in any financial asset or presented product or event. We are not responsible for your investing results