Enjin Coin (ENJUSD) Sellers Could Ignite a Price Tendency Downward
Estimated Reading Time: 2 minutes
Don’t invest unless you’re prepared to lose all the money you invest. This is a high-risk investment and you are unlikely to be protected if something goes wrong. Take 2 minutes to learn more
ENJUSD Analysis – Crypto Buyers Struggle to Gain More Ground
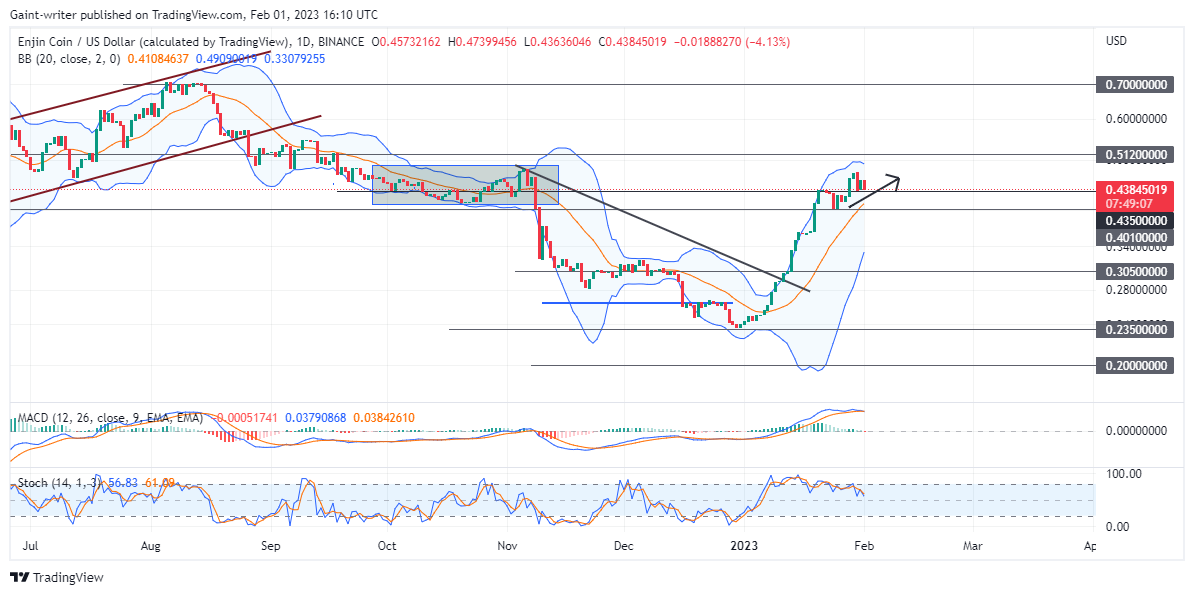
ENJUSD sellers could ignite a price tendency downward. The market setup comprises a buying decline as sellers begin to opt-in for a ride. The buying momentum has recently declined ever since the $0.435000 key zone was broken in the market. Rather than a successful progression of bullish influence on the crypto market, the buyer decided to slow down. The bulls can only make a successful buying approach beyond the $0.512000 key zone if more investors decide to dive deeper into buying more shares. Nevertheless, the sellers play their cards right as a downturn seems plausible on the daily chart.
ENJUSD Market Levels
Resistance Levels: $0.70000, $0.512000, $0.435000
Support Levels: $0.23500, $0.20000, $0.305000

The bullish traders have been making a comeback against the selling buildup that has lasted for some months. The price fell from the key level of $0.70000 due to buying resistance. From this month’s high level, the sellers and traders begin to descend lower. The crypto value continues to depreciate. The sellers extended their selling strength as more phase above the $0.40000 key zone.
At this stage, the sellers continue to see a decline in the market. Buyers re-entered the ENJUSD price at the $0.235000 significant zone. From this key level, the price was able to grow back to the $0.435000 key zone. The MACD (Moving Average Convergence and Divergence) indicator has risen to its peak as the signal line is beginning to glide lower on the daily timeframe.

Market Expectation
On the 4-hour chart, the sellers are already marking out a selling tendency. The stochastic oscillator has crossed downward as selling pressure is now beginning to persist. Before buyers resume the trend, sell traders may break through the $0.435000 key zone.
You can purchase Lucky Block here. Buy LBLOCK
Note: Cryptosignals.org is not a financial advisor. Do your research before investing your funds in any financial asset or presented product or event. We are not responsible for your investing results.