Ethereum Begins Its Descent as It Hits the $3,800 Resistance Level
Estimated Reading Time: 2 minutes
Don’t invest unless you’re prepared to lose all the money you invest. This is a high-risk investment and you are unlikely to be protected if something goes wrong. Take 2 minutes to learn more

Ethereum Price Long-Term Analysis: Bullish
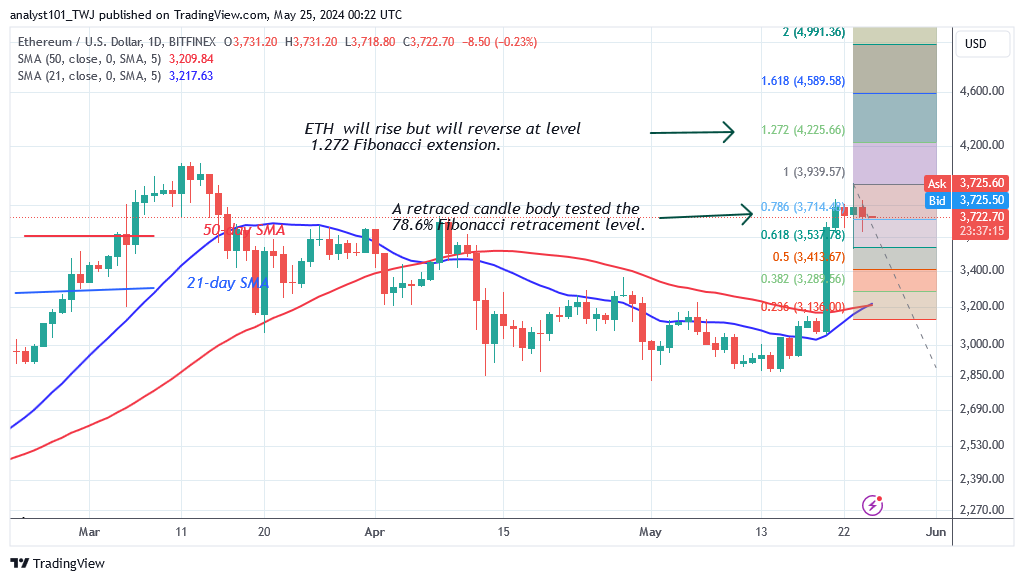
Ethereum’s (ETH) upward trend has been below $3,900 since May 21 as it hits the $3,800 resistance level. The cryptocurrency price has been fluctuating below the resistance level, indicating a bullish trend. On the upside, if the bulls break the $3,900 barrier, Ether will rise beyond the $4,000 psychological price mark.
During the May 23 rally, a retraced candle body tested the 78.6% Fibonacci retracement line. The retracement predicts that Ether will rise but then reverse at the 1.272 Fibonacci extension, or $4,225.66. In the meantime, ETH/USD is currently valued at $3,722.
Technical indicators:
Major Resistance Levels – $3, 600, $3,800, $4,000
Major Support Levels – $2.600, $2, 400, $2,200
Ethereum Indicator Analysis
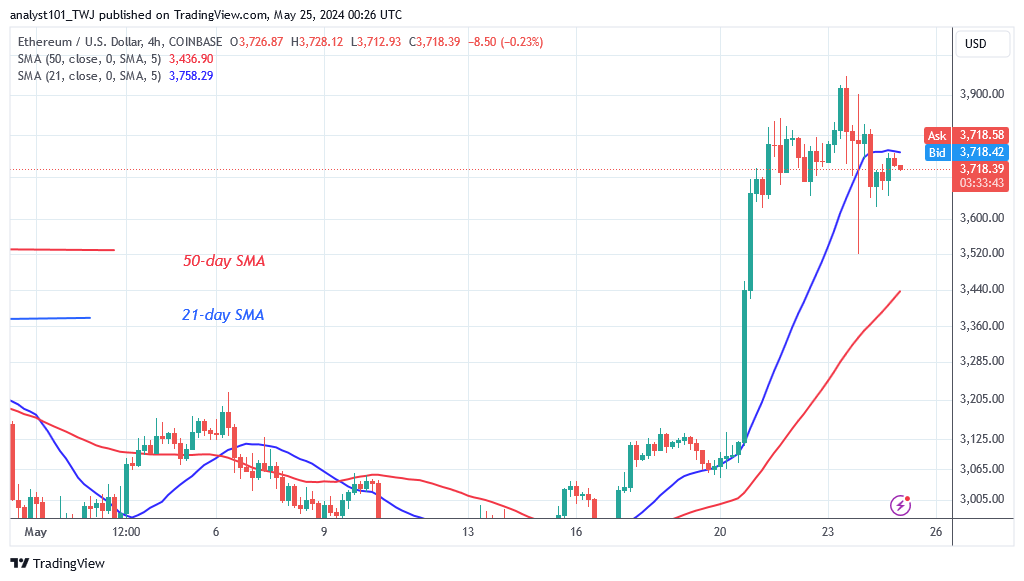
Since the breakout on May 20, Ether’s price bars have been above the moving average lines. The moving average lines are making a bullish crossover, with the 21-day SMA crossing above the 50-day SMA. This will be a bullish indicator for the cryptocurrency. On the 4-hour chart, the price bar is below the 21-day and above the 50-day SMA. The cryptocurrency will drop while fluctuating between the moving average lines.
Conclusion
The largest altcoin is in decline as it hits the $3,800 resistance level. The cryptocurrency price has fallen below the 21-day SMA and retested it. The negative momentum is expected to continue to a low above the 50-day SMA, or $3,440 low. Meanwhile, the cryptocurrency signal is unfavorable as the altcoin begins selling pressure.
You can purchase Lucky Block here. Buy LBLOCK
Note: Cryptosignals.org is not a financial advisor. Do your research before investing your funds in any financial asset or presented product or event. We are not responsible for your investing results