Ethereum (ETH) Slumps as Sellers Emerge in the Overbought Region
Estimated Reading Time: 2 minutes
Don’t invest unless you’re prepared to lose all the money you invest. This is a high-risk investment and you are unlikely to be protected if something goes wrong. Take 2 minutes to learn more

Ethereum Price Long-Term Analysis: Bullish
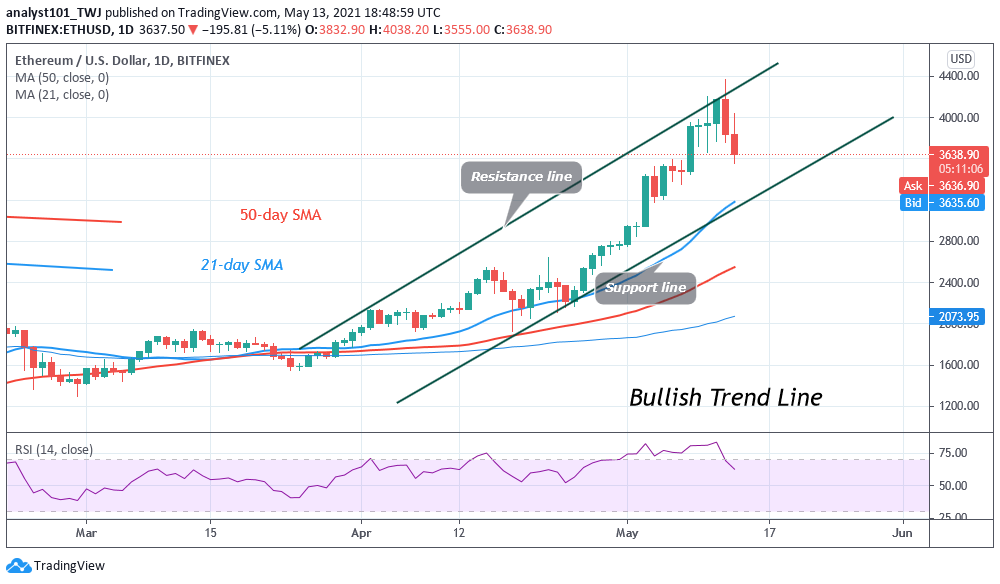
Ethereum is in a downward move. Ether retested the $4,400 resistance zone and has dropped to $3,646 at the time of writing. The biggest altcoin is falling because the coin has been trading in the overbought region of the market. Since April 30, the crypto reached the overbought region. The coin will further depreciate if price beaks below $3,600 support.
Ethereum Indicator Analysis
Ether was at level 83 before dropping to 64 of the Relative Strength index period 14. The market is now in the uptrend zone. On the daily chart, the crypto’s price is above the moving averages. This suggests that the market is in the bullish trend zone. Ether is below 40% of the daily stochastic. It indicates that the market is in a bearish momentum.
Technical indicators:
Major Resistance Levels – $2,000, $2, 500, $2,700
Major Support Levels – $1.500, $1,300, $1,100
What Is the Next Direction for Ethereum?
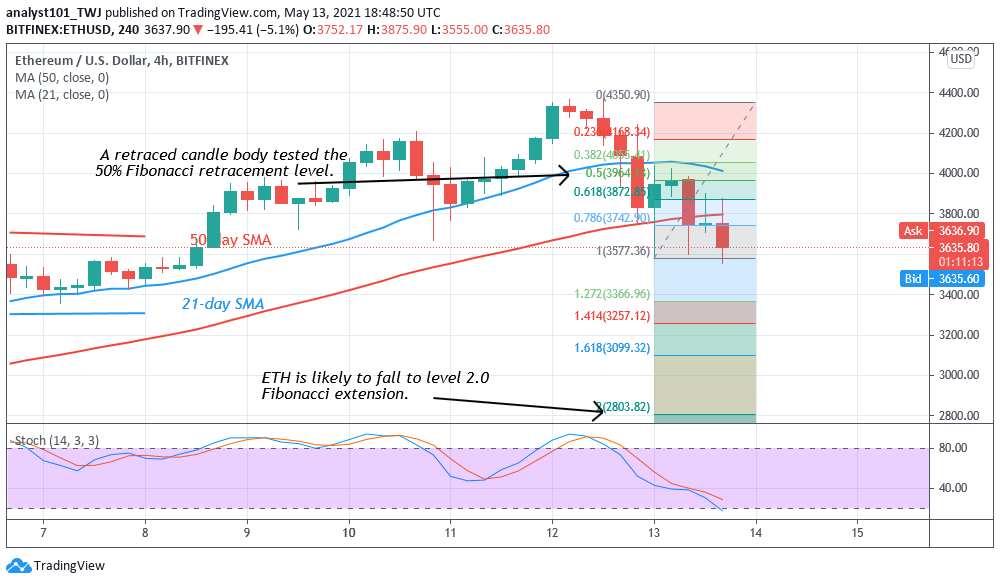
Ethereum is in a downward move. On the 4-hour chart, the bears have broken below the moving averages which indicate that the altcoin will fall. On May 13 downtrend; a retraced candle body tested the 50 % Fibonacci retracement level. This retracement implies that Ethereum will fall to level 2.0 Fibonacci extension or level 2803.82.
Note: Learn2Trade.com is not a financial advisor. Do your research before investing your funds in any financial asset or presented product or event. We are not responsible for your investing results