BNB (BNB/USDT) Stays Strong While Market Awaits Breakout Move
Estimated Reading Time: 3 minutes
Don’t invest unless you’re prepared to lose all the money you invest. This is a high-risk investment and you are unlikely to be protected if something goes wrong. Take 2 minutes to learn more
BNB/USDT Long-term Analysis: Ranging
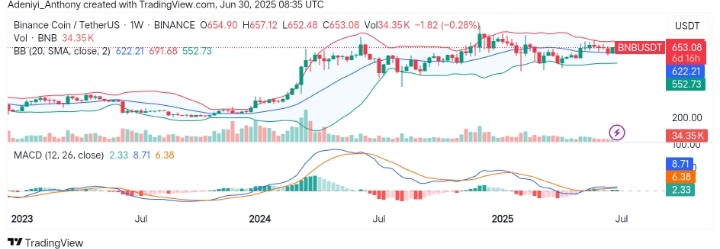
The weekly chart of BNB against the Tether has shown a market in sideways consolidation after a strong rally in early 2024. However, the price has been hovering within a tight range between $620 and $690, signaling a lack of strong momentum from both bulls and bears.
Recently, the Bollinger Bands are narrowing, suggesting a breakout may be approaching. However, with decreasing volume and a flattening MACD, the market sentiment is cautiously neutral, awaiting a propelling force.
To this end, BNB trades at $653.08, recording over 37 thousand traded volumes at the beginning of the week.
Technical Indicators
Major Resistance Levels: $690, $675, and $705
Major Support Levels: $622, $552, and $500
BNB Weekly Technical Analysis
Technically, the weekly analysis of BNB against the Tether shows a trading pair that experienced a surge in price in late 2024 but has been moving within a tight range since then, with the Bollinger Bands hinting at indecision among participants.
On the other hand, MACD suggests consolidation rather than strength, as the histogram shows a fading bullish momentum as the MACD line (blue) is barely above the signal line. To this end, the decreasing volume confirms that market participants are waiting for a breach above or below $675 or $622, which would either signal a bullish continuation or a retracement.
BNB/USDT Daily Analysis: A Bullish Growth or Retracement?
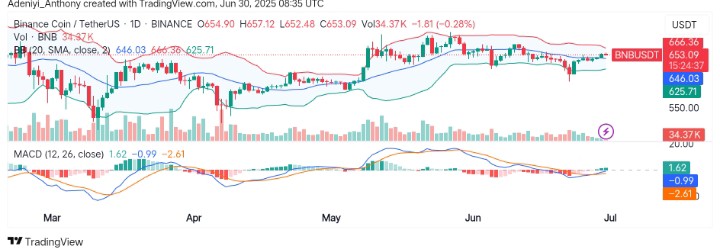
On the daily timeframe, BNB/USDT continues to trade on a straight line, confirming the range-bound movement. However, with the price moving just below the upper Bollinger Band at $666.36, the pair’s price may be moving toward a minor resistance.
From another perspective, the MACD is attempting a bullish crossover but remains just beneath the baseline, hinting at cautious optimism as the volume remains low and stable, suggesting limited conviction from both bulls and bears.
To this end, if $646 (middle band) is still intact, a daily close above $666 with increased volume could be an early breakout trigger toward $690; otherwise, a retracement towards $522 may be seen.
You can purchase crypto coins here. Buy LBlock