Ethereum (ETH/USDT) Exhibits Consolidation; Bulls Eye Critical Resistance Levels
Estimated Reading Time: 4 minutes
Don’t invest unless you’re prepared to lose all the money you invest. This is a high-risk investment and you are unlikely to be protected if something goes wrong. Take 2 minutes to learn more

Ethereum against Tether has gained 3.97% in the last 24 hours, outpacing the broader crypto market’s 3.62% rise. This price increase is mainly driven by three factors. First, there is growing excitement around the upcoming Fusaka upgrade, scheduled for December 3, which promises to improve Ethereum’s scalability. Second, the increasing inflow of funds into U.S. spot ETH exchange-traded funds (ETFs) has also supported the price. On November 26, $78 million was added to these ETFs, marking the fourth consecutive day of positive inflows.
Additionally, whale activity with regard to the air has played a key role in driving up Ethereum’s value. Institutions such as Immersion Technologies have been accumulating significant amounts of ETH. As it stands, during last week alone, the firm added 69,822 ETH, worth about $197 million. This institutional buying has created a bullish sentiment, further boosting Ethereum’s price and contributing to its recent outperformance in the crypto market.
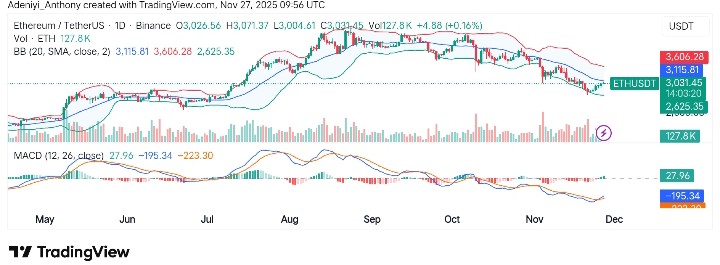
Currently, Ethereum trades at $3,031.45 with more than 127,000 on the daily timeframe.
Technical Indicators
Major Resistance Levels: $3,070.84, $3,165.00, and $3,606.28
Major Support Levels: $2,938.00, $2,625.00, and $2,500.00
Technical Analysis
Technically, the market for Ethereum against Tether shows a trend of price consolidation within the range of $3,031.45 to $3,606.28, as observed on the daily chart. As it stands, a slight uptick of +0.16% over the 24-hour period has been recorded. However, the pair is positioned near the middle of the Bollinger Bands, implying that the current price action is neutral. However, the MACD on the daily chart suggests more upside ground can still be claimed, but caution based on the curvature of the Bollinger Bands indicates the presence of the bears.
To this end, if the pair can claim the $3,165 level, a fresh start to the north may be considered, but till then, the price continues to consolidate at the current level.
Today’s Ethereum Update
In a recent development, the market for Ethereum has been trending upward, correcting towards $3,165 with support around $2,700 and $2,900. However, this may not be an impulsive move, but it appears that the pair is moving within an upside price channel, aiming for the north with increasing volume.
To this end, it was also observed that a pullback may be recorded before a continued upside. However, both analyses indicate the token is going up.
ETH/USDT Analysis: Potential Breakout or Breakdown Ahead?
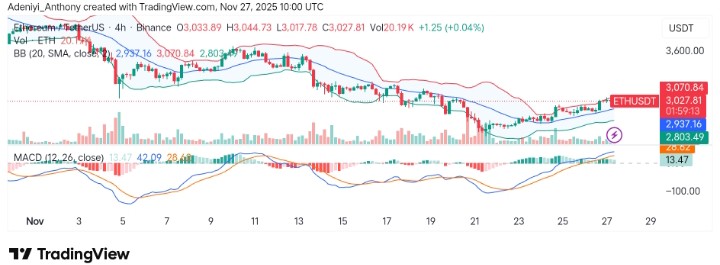
The analysis of ETH/USDT on the 4-hour timeframe reveals a bullish reversal pattern forming within the $2,937.16 to $3,070.84 range. However, the pair price appears to be currently testing the upper Bollinger Band, suggesting potential for a breakout above $3,070.84 if the upward momentum persists.
On the other hand, the MACD, with a reading of 28.62, shows that the bullish momentum is growing stronger, with the signal line crossing above the MACD line. This indicates increasing buying interest in the short term, confirming the likelihood of further price movement to the upside, provided momentum is sustained.
You can purchase crypto coins here. Buy Crypto