Ethereum (ETH/USDT) Struggles Below Critical Resistance Amidst Bearish Momentum
Estimated Reading Time: 3 minutes
Don’t invest unless you’re prepared to lose all the money you invest. This is a high-risk investment and you are unlikely to be protected if something goes wrong. Take 2 minutes to learn more
The market for Ethereum against Tether has been experiencing severe downward pressure, aligning with the broader crypto market. The pair has been moving downward after several formations of minor upside corrections, signaling the efforts of the bears to keep the current position.
As it stands, the pair is struggling to hold above the $3,000 level under the cluster of moving averages, both on the daily and shorter timeframes. However, the Stochastic RSI on the 4-hour window suggests more downward pressure is on the way.
As it stands, several fundamentals have been highlighted to be affecting the pair, but the most prominent of them are the failed $1b institutional deal, technical breakdowns (sharp drops below support levels that trigger automatic sell orders known as stop-losses), and the uncertainty that surrounds the Fed rate cut (potential lowering of U.S. central bank interest rates).
Currently, Ethereum trades at $3,038, recording more than 170 thousand for the day already.
Technical Indicators
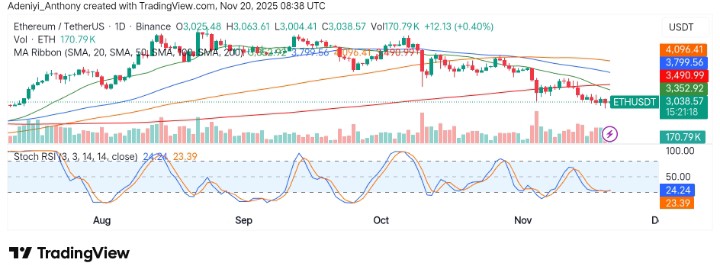
Major Resistance Levels: $3,352.92, $3,799.56, and $4,096.00
Major Support Levels: $3,000.00, $2,800.00, and $2,680.00
Technical Analysis
On the daily timeframe, Ethereum against Tether at the moment appears to be consolidating within a bearish structure despite different attempts at regaining bullish momentum. As it stands, the pair has failed to hold above different support levels, and it seems the next level might be to find a stronger support around the $2,000 level, as the substantial move towards immediate resistance s have not been maintained.
The Stochastic RSI, on the other hand, suggests the pair might be oversold and potentially in a position for a reversal. However, the market might be a continuation of the current trend, depending on the reaction from the forces of the market.
To this end, a break below $3,000 would indicate a move towards $2,800, or even $2,680 if the bears are allowed to reign for long in the market.
Today’s Update of Ethereum
So far, the market for Ethereum has not made any bullish attempts, and indicators on the chart suggest there might be a wave to further downside as the price extends towards $2,626. However, evidence that supports a corrective move to the upside is yet to form, as each upside correction has always failed to stay above any resistance.
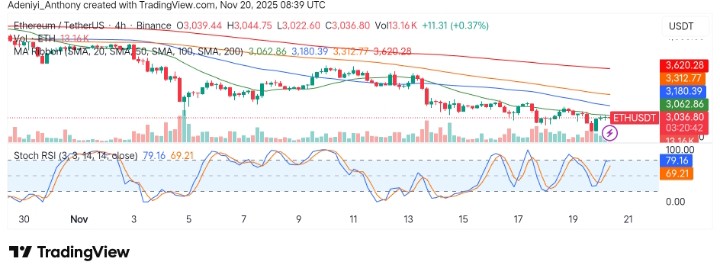
ETH/USDT: A Breakdown or Breakout?
Activities of the ETH/USDT on the 4-hour chart show a smaller proportion of the price action on the daily session. However, the pair has been consolidating close to the moving average ribbon, just that most of the lines of the averages are moving to the south with the price under it.
Additionally, the Stochastic RSI signals that the pair on the short-term may be enjoying some bullish rally. However, the overbought condition of the momentum oscillator, coupled with the low volume, shows the pair may need to test lower levels.
You can purchase crypto coins here. Buy Crypto
