Ethereum (ETH/USDT) Faces Pressure as Price Signals Potential for a Reversal
Estimated Reading Time: 3 minutes
Don’t invest unless you’re prepared to lose all the money you invest. This is a high-risk investment and you are unlikely to be protected if something goes wrong. Take 2 minutes to learn more
Ethereum against Tether has recently experienced some volatility, as seen in the latest price action. After reaching recent highs around $4,500, the pair is testing critical support levels at $4,300, showing signs of a possible price reversal.
At the moment, the market sentiment is currently leaning towards caution, with an interlocked daily Guppy Multiple Moving Averages (GMMA) indicator, which suggests potential breakouts on either side.
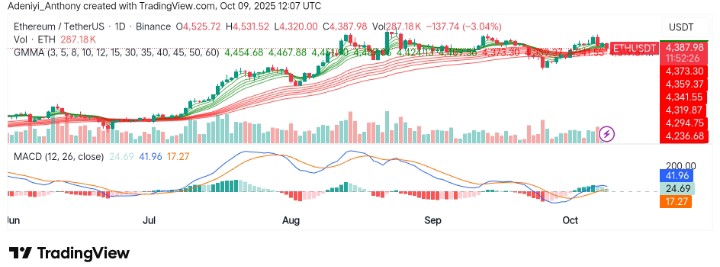
Currently, Ethereum trades at $4,387.98 with over 287 thousand traded volumes for the day.
Technical Indicators
Major Resistance Levels: $4,456, $4,530, and $5,000
Major Support Levels: $4,320, $4,105, and $4,017
Technical Analysis
On the daily timeframe, Ethereum against Tether is at a critical juncture, potentially open for both upward and downward moves. The MACD, on one side, is still showing positive momentum but has started to slow down, indicating a potential bearish crossover if the bulls don’t reclaim levels higher than $4,500. Additionally, the trading volume indicates waning momentum as indecision increases in the market.
The GMMA, on the other side, is slightly bullish, with short-term EMAs above long-term ones. However, the tightening formation of the candles around the indicator suggests potential volatility ahead.
To this end, a break above resistance levels could lead to further bullish action. Meanwhile, failure to hold above the current support could lead to a deeper retracement.
Ethereum Still Aiming for the $5,000 Target
After the topic that formed in the month of August, Ethereum’s price has formed a 3-wave corrective move down towards a critical support area. However, the market pattern is still bullish, as the September support is still holding.
Meanwhile, on the hourly timeframe, ETH appears to be displaying a specific price channel, which may cause further fall in value. However, the price may start another uptrend once a strong base is confirmed at the current level in a move that may extend beyond $4,700.
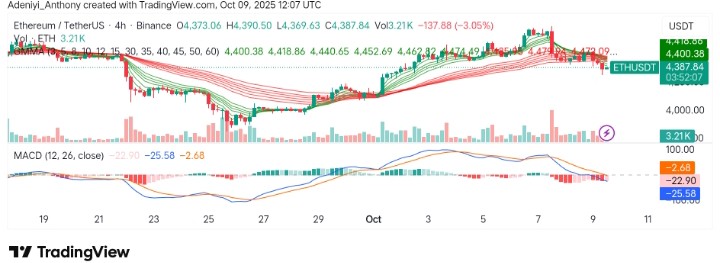
ETH/USDT Faces Potential Pullback as Bearish Pressure Builds
On the 4-hour timeframe, the price of ETH/USDT appears to be under strong selling pressure, with a decline of about 3.05%.
At the moment, the pair’s price is struggling to maintain the bullish momentum after a sharp rise. Meanwhile, the MACD is already displaying red histograms, with both the signal and MACD lines drifting further apart.
From another perspective, the GMMA shows a potential shift, with the short-term moving averages beginning to cross below the long-term ones, suggesting a possible reversal.
To this end, with volume decreasing, Ethereum could face a deeper retracement if key support levels are broken. The next few hours will be critical for determining whether a bullish recovery is possible or if bearish continuation takes hold.
You can purchase crypto coins here. Buy Crypto