Ethereum (ETH/USDT) Positioned for a Big Move Despite Growing Caution
Estimated Reading Time: 3 minutes
Don’t invest unless you’re prepared to lose all the money you invest. This is a high-risk investment and you are unlikely to be protected if something goes wrong. Take 2 minutes to learn more
Ethereum Long-term Analysis: Ranging
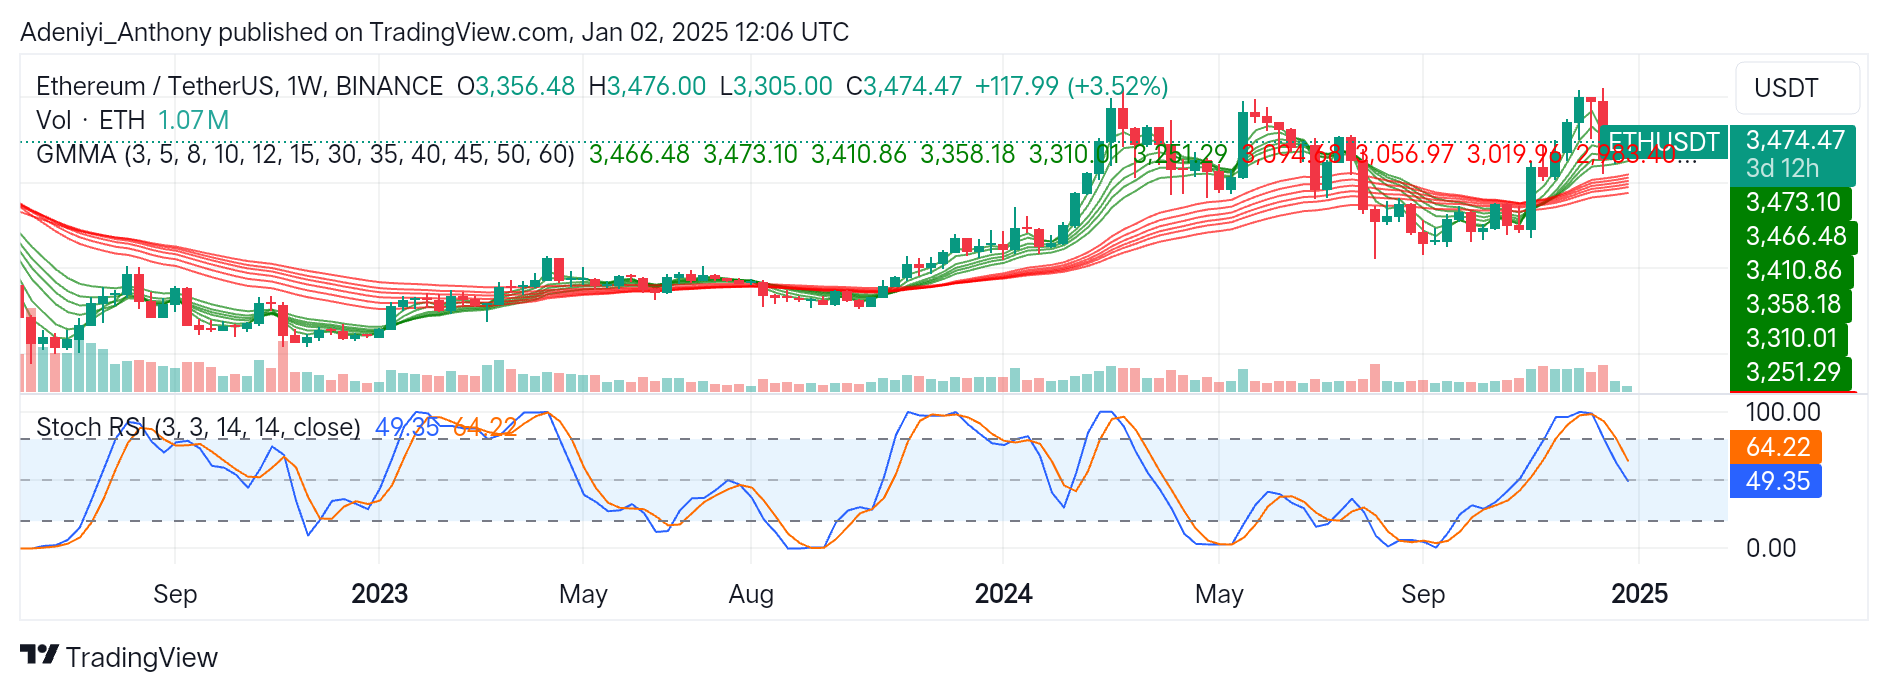
The market for Ethereum against the Tether has shown a notable uptick in the recent weekly performance after consolidating with a tight range. This suggests the pair is positioned for more gain. However, despite the recent gain of 3.52%, the indicators on the chart below suggest caution as the current uptick lacks market participation.
The ETH market has experienced significant volatility during recent trading sessions, evidenced by the series of highs and lows on the chart. However, with the market showing signs of recovery from the previous dip and price tending towards $3,500, traders are watching for a trend continuation or potential consolidation phase.
Currently, Ethereum is trading at $3,474.47 with 1.07 million traded weekly volumes.
Technical Indicators
Major Resistance Levels: $3,500.00, $3,600.00, and $3,750.00
Major Support Levels: $3,410.86, $3,358.18, and $3,100.00
Ethereum Technical Analysis
On a weekly timeframe, the market for Ethereum against the Tether has reflected a sign of recovery towards recent resistance levels after forming a bullish candlestick. The upside-diverging shorter EMAs of the Guppy Multiple Moving Averages (GMMAs) suggest an increasing bullish momentum and an emerging buying interest. However, the positioning of the Stochastic RSI, though near an overbought region, indicates the current uptick lacks strong conviction.
To this end, as market trading volume increases beyond 1.07 million, a sustained break above $3,500 would indicate a strong trajectory to the North; otherwise, a dip below $3,400 would suggest continued range-bound movement.
ETH/USDT Analysis: What’s Next?
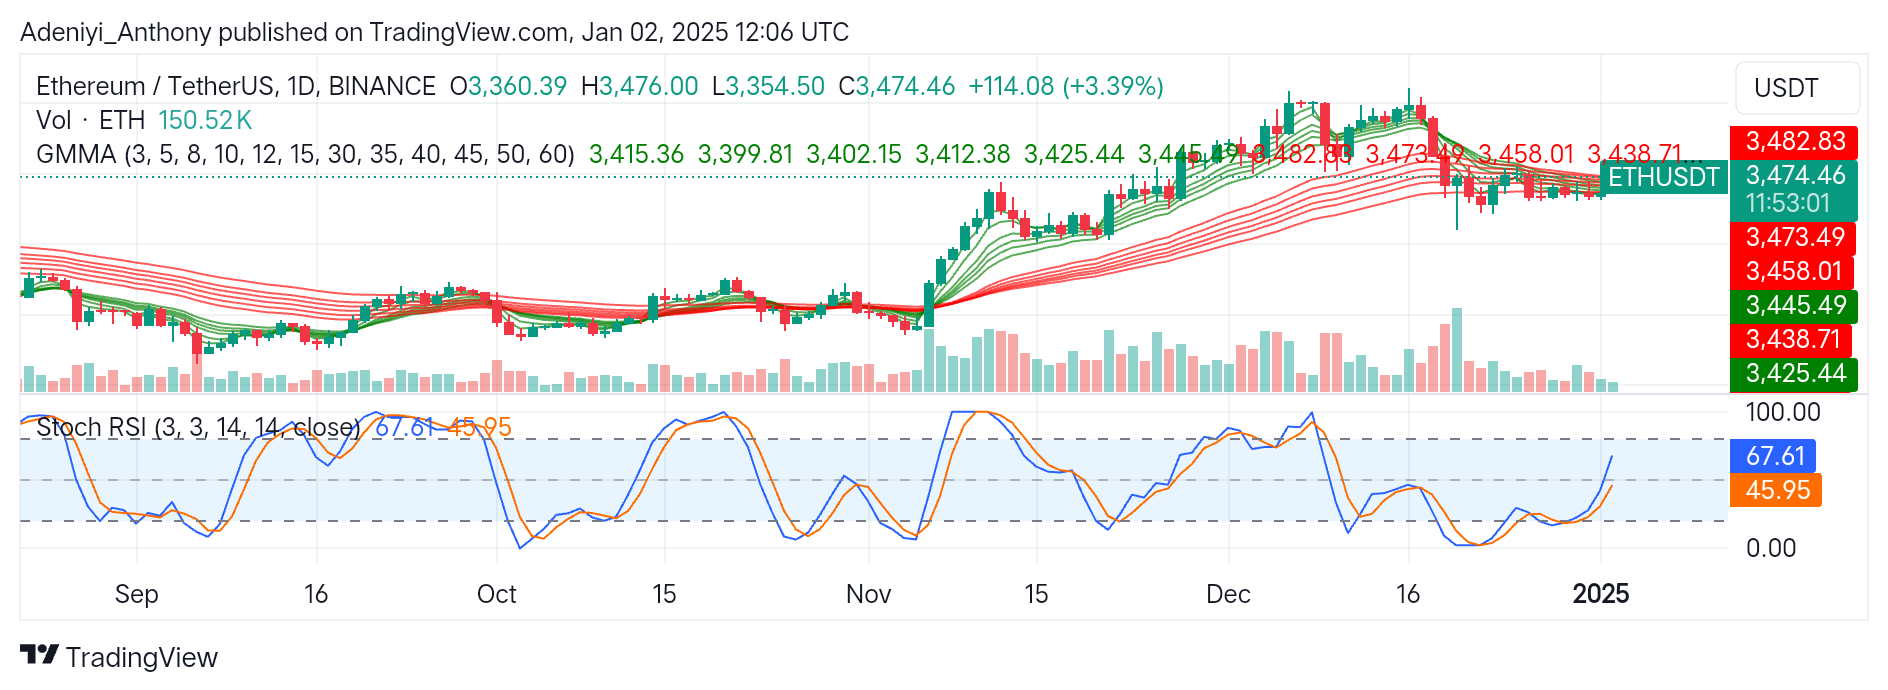
On the daily timeframe, ETH/USDT is exhibiting a sign of steady upward momentum following a brief consolidation phase. This suggests a renewed buying pressure as the price hovers near $3,480, a short-term resistance level.
However, in this timeframe, the GMMAs and the Stochastic RSI are showing signs of improvement. The GMMAs are converging, but the upward-moving sets of EMAs reinforce the ongoing bullish momentum. On the other hand, the oscillator below the chart shows the rate at which the pair is rising.
To this end, as daily trading volumes increase, traders should monitor the $3,480 level while keeping an eye on the lines of the Stochastic oscillator for a potential sign of exhaustion or confirmation of uptrend strength.
You can purchase crypto coins here. Buy LBlock