Ethereum (ETH/USD) Hints at Potential Recovery Amid Growing Market Caution
Estimated Reading Time: 3 minutes
Don’t invest unless you’re prepared to lose all the money you invest. This is a high-risk investment and you are unlikely to be protected if something goes wrong. Take 2 minutes to learn more
Ethereum Long-term Analysis: Bullish
The market for Ethereum against the United States dollar has witnessed volatility in previous trading sessions, evidenced in its bullish trajectory towards $4,000 before this time.
Ethereum has surged significantly in the previous weeks, reflecting renewed investors’ confidence and growing market demand. However, despite the optimism, the growing overbought signs, highlighted by the Stochastic RSI, suggest a potential price correction might be on the horizon. To this end, the price of Ethereum may dip towards $2,910.43 with increased selling pressure in the short term.
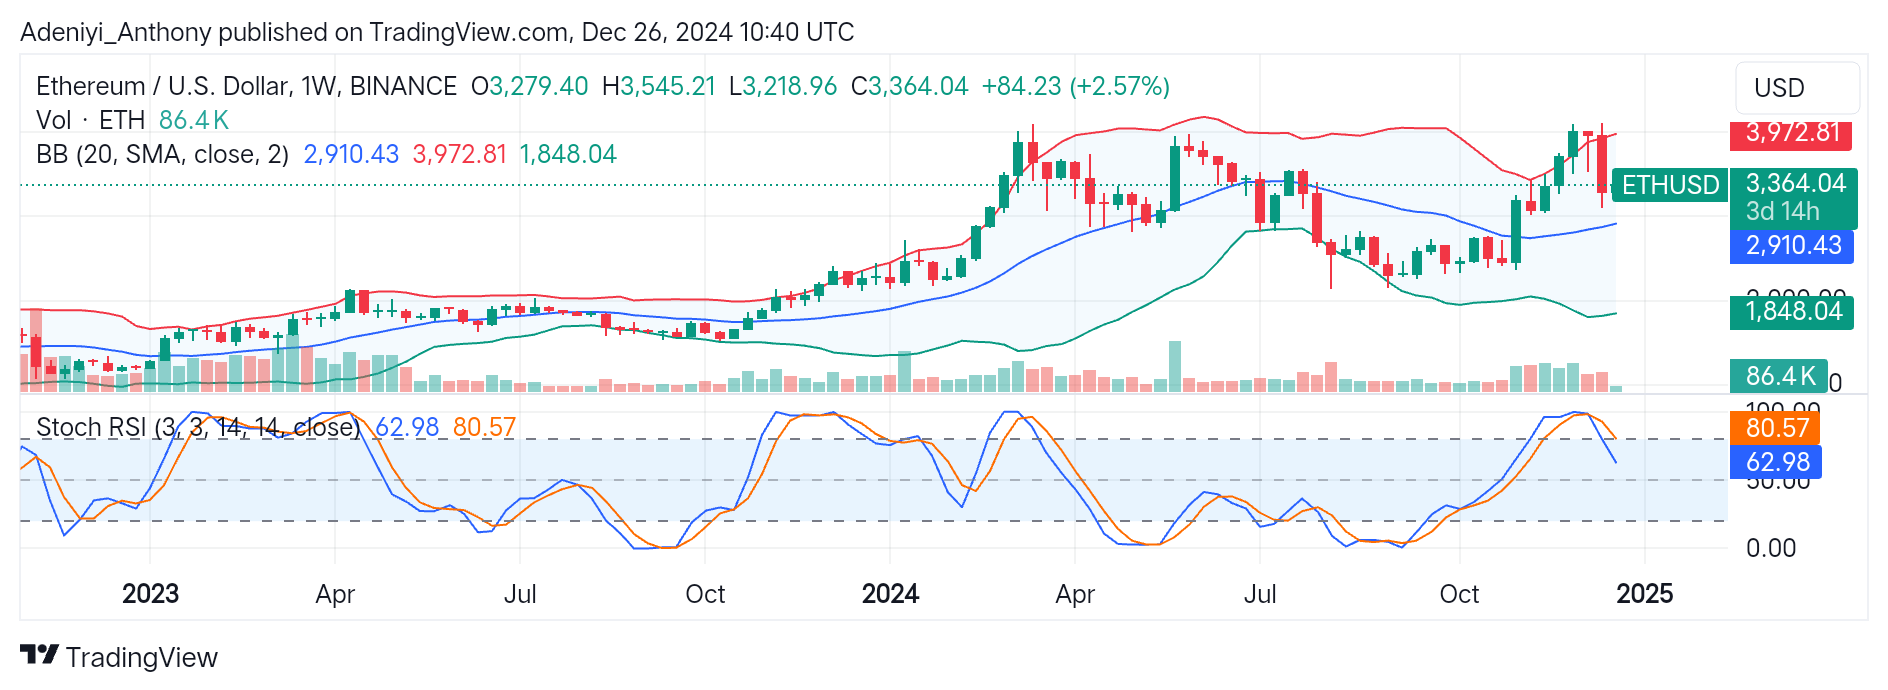
Currently, ETH/USD is trading at $3,364.04, with over 86 thousand traded volumes.
Technical Indicators
Major Resistance Levels: $3,545.21, $3,972.81, and $4,500.00
Major Support Levels: $2,910.43, $2,500.00, and $1,848.04
Ethereum Technical Analysis
The analysis of Ethereum against the USD weekly timeframe shows that the pair is currently exhibiting a sign of renewed hope with the formation of a small bullish tick. However, the price actions between the upper segment of the Bollinger Bands suggest the pair may be overbought as the price faces a $3,545.21 resistance level.
On the other hand, the Stochastic RSI suggests a potential downside correction as the oscillator’s lines point to the south. To this end, as ETH/USD eyes the $4,000, the $2,910.34 may be a critical turning point as indicators signal overbought conditions.
ETH/USD Analysis: A Recovery or Corrective Move?
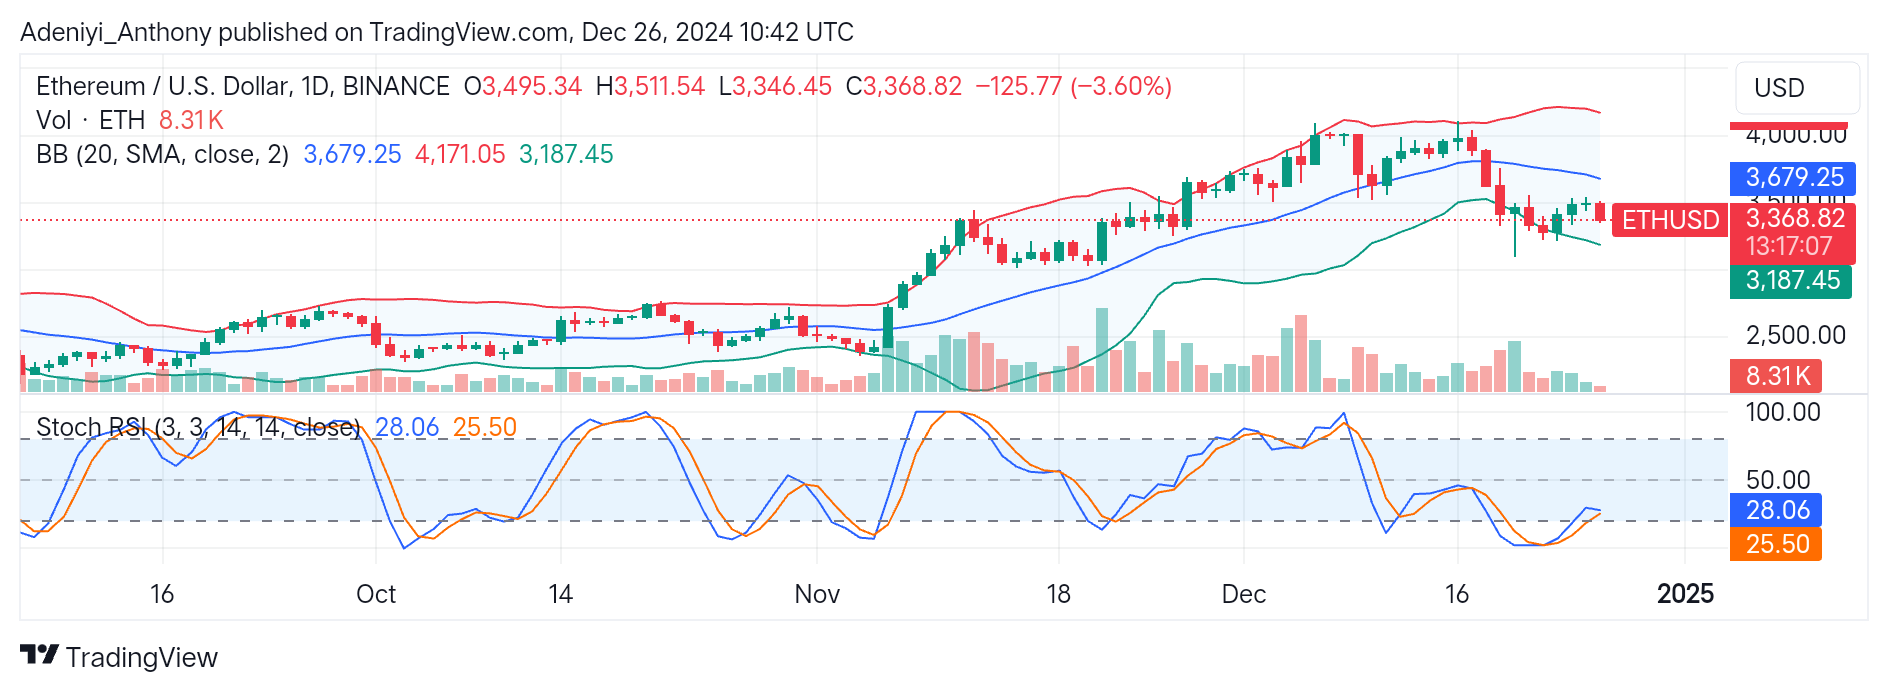
ETH/USD on a daily timeframe appears to operate between the lower segment of the Bollinger bands. However, the bands hint at the possibility of due to its expansion.
On the other hand, the Stochastic RSI suggests an oversold condition as both lines read extremely low figures. This may indicate a potential rebound, but a confirmed bullish crossover is needed for an upside recovery.
To this end, a break below $3,187.45 would hint at further downside correction; otherwise, a break above $3,511.54 may signal recovery to the North.
You can purchase crypto coins here. Buy LBlock