Ethereum (ETH/USDT) Seeks to Hold Above $3,071
Estimated Reading Time: 3 minutes
Don’t invest unless you’re prepared to lose all the money you invest. This is a high-risk investment and you are unlikely to be protected if something goes wrong. Take 2 minutes to learn more
Ethereum Long-term Analysis: Bearish
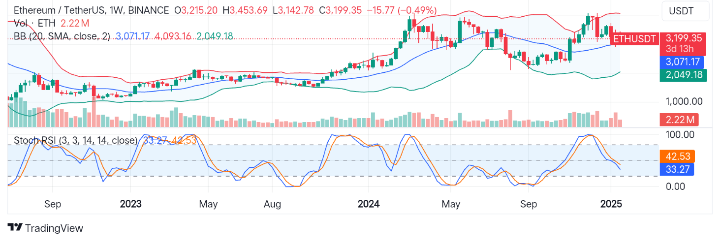
The market for Ethereum against the Tether has been bullish, forming higher highs and lows since 2024.
However, recent price actions around the mid-Bollinger Band show the pair has seen a dip after testing a strong resistance zone.
Recently on the chart, the pair’s action has shown a potential pullback as the formation of bearish candles close to the upper bands extends further towards $3,071. The appearance of the lines of the Stochastic oscillator suggests that the price may not hold above the current support, capturing the take-profit going on in the market.
Currently, as the market awaits clearer signs, Ethereum is trading at $3,119.35 with little weekly participation of about 2.22 million.
Technical Indicators
Major Resistance Levels: $3,450, $3,800, and $4,100
Major Support Levels: $3,071, $2,950, and $2,050
Ethereum Technical Analysis
The analysis for Ethereum on the weekly timeframe shows a market with waning bullish momentum as seller dominance prevails in an action that indicates a take-profit action of the buyer. Though the pair’s prices operate above the $3,000 level.
Recently, Ethereum has tested the $3,450 level. However, as the Bollinger bands show a narrowing pattern, it suggests a potential reduced volatility, a situation clearly stated by the number of market participants.
Moreover, the Stochastic RSI below the chart also signals a further dip as lines operate under the 50-mark level. To this end, a recovery towards $3,450 would return the market to its former bullish situation; otherwise, failure to hold above $3,000 would indicate more declines.
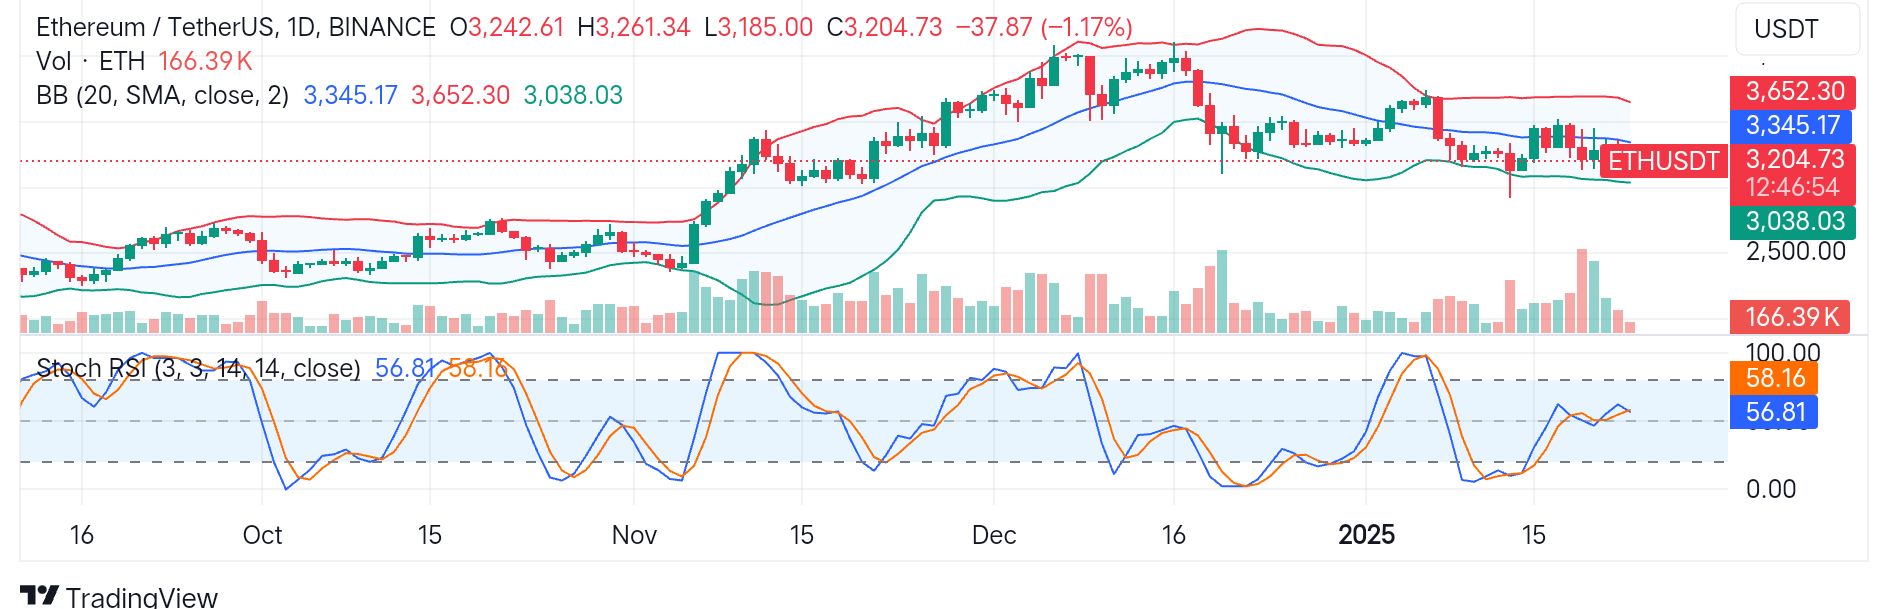
ETH/USDT Analysis: Where from Here?
On the daily timeframe, ETH/USDT ranges within the right levels. However, the current price moving below the mid-band indicates a short-term seller dominance as seen in daily trading volume.
On the other hand, the Stochastic signals price lacks direction as the lines extend to the front around the 40-mark level.
To this end, an upward change in direction if the Stochastic lines would mean price actions towards $3,450; otherwise, southward movement denotes the continuation of the current decline.
You can purchase crypto coins here. Buy LBlock