Ethereum (ETH/USDT) Targets a Spot Above $3,900 Amid Potential Pullback
Estimated Reading Time: 3 minutes
Don’t invest unless you’re prepared to lose all the money you invest. This is a high-risk investment and you are unlikely to be protected if something goes wrong. Take 2 minutes to learn more
ETHUSDT Mid-term Analysis: Bullish
Recently, the sentiment around the Ethereum market against Tether has experienced a strong bullish rally. The price action has demonstrated a sharp upward momentum, moving beyond a key resistance as the pair’s value advances past the $3,600 psychological level.
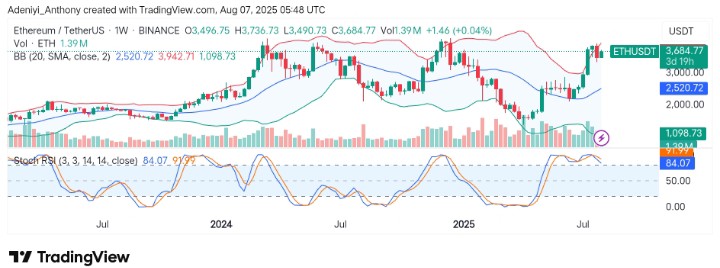
At the moment, the pair seems to be making another attempt towards the north with increasing volumes on the weekly chart. However, the Stochastic RSI signals that the momentum appears to be dropping as ETH trades near a resistance level.
Currently, Ethereum trades at $3,684.77 with over 1.3 million weekly traded volumes already.
Technical Indicators
Major Resistance Levels: $3,736, $3,942, and $4,000
Major Support Levels: $3,496, $2,000, and $2,700
Ethereum Technical Analysis
The analysis of Ethereum against the Tether on a weekly timeframe shows the pair is advancing towards a significant threshold with an increase in participation that is particularly steady. However, the price action close to the upper region of the Bollinger Bands suggests high volatility, and a breakout above this level could offer more gains for the pair.
On the other hand, the positioning of the Stochastic RSI suggests the pair could be in the later stages of its rally as the lines curl to the south, suggesting a reduced momentum. To this end, if the price holds above the current support level, a move above $3,900 could be initiated; otherwise, a correction below this level would indicate a decline below the dynamic mid-band level.
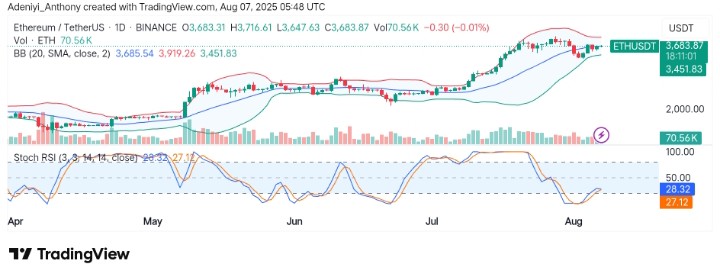
ETH/USDT Analysis: Consolidating for Further Gains
On the daily timeframe, ETH/USDT appears to be ranging with a strong bullish bias in the long term. The price seems to be trading around the dynamic line within constricted Bollinger Bands, suggesting reduced volatility.
Also, the Stochastic oscillator seems to be moving lower into the oversold region, indicating a short-term pullback as the lines curl downward.
To this end, if the price breaks below $3,450, the pair might see further retracement towards $3,000. However, if the ETH can maintain a position above the current position with a consistent volume, the pair may record a value above $3,800 in the near term.
You can purchase crypto coins here. Buy LBlock