Ethereum Price Records Slight Uptick and ABC Wave Structure Amid Strong Sell-Off
Estimated Reading Time: 3 minutes
Don’t invest unless you’re prepared to lose all the money you invest. This is a high-risk investment and you are unlikely to be protected if something goes wrong. Take 2 minutes to learn more

The Ethereum price in the last 24 hours has risen by 1.14% to $1,969.83, outperforming the broader market. This movement appears to be primarily driven by capital outflow from Bitcoin into higher-beta altcoins. This is evidenced in the rising altcoin market capitalization, the technical bounce from oversold conditions, and improving sentiment in the altcoin market.
Looking ahead, Ethereum needs to hold above the current position to potentially test the higher levels, as a drop below the $1,749 support level could occur.
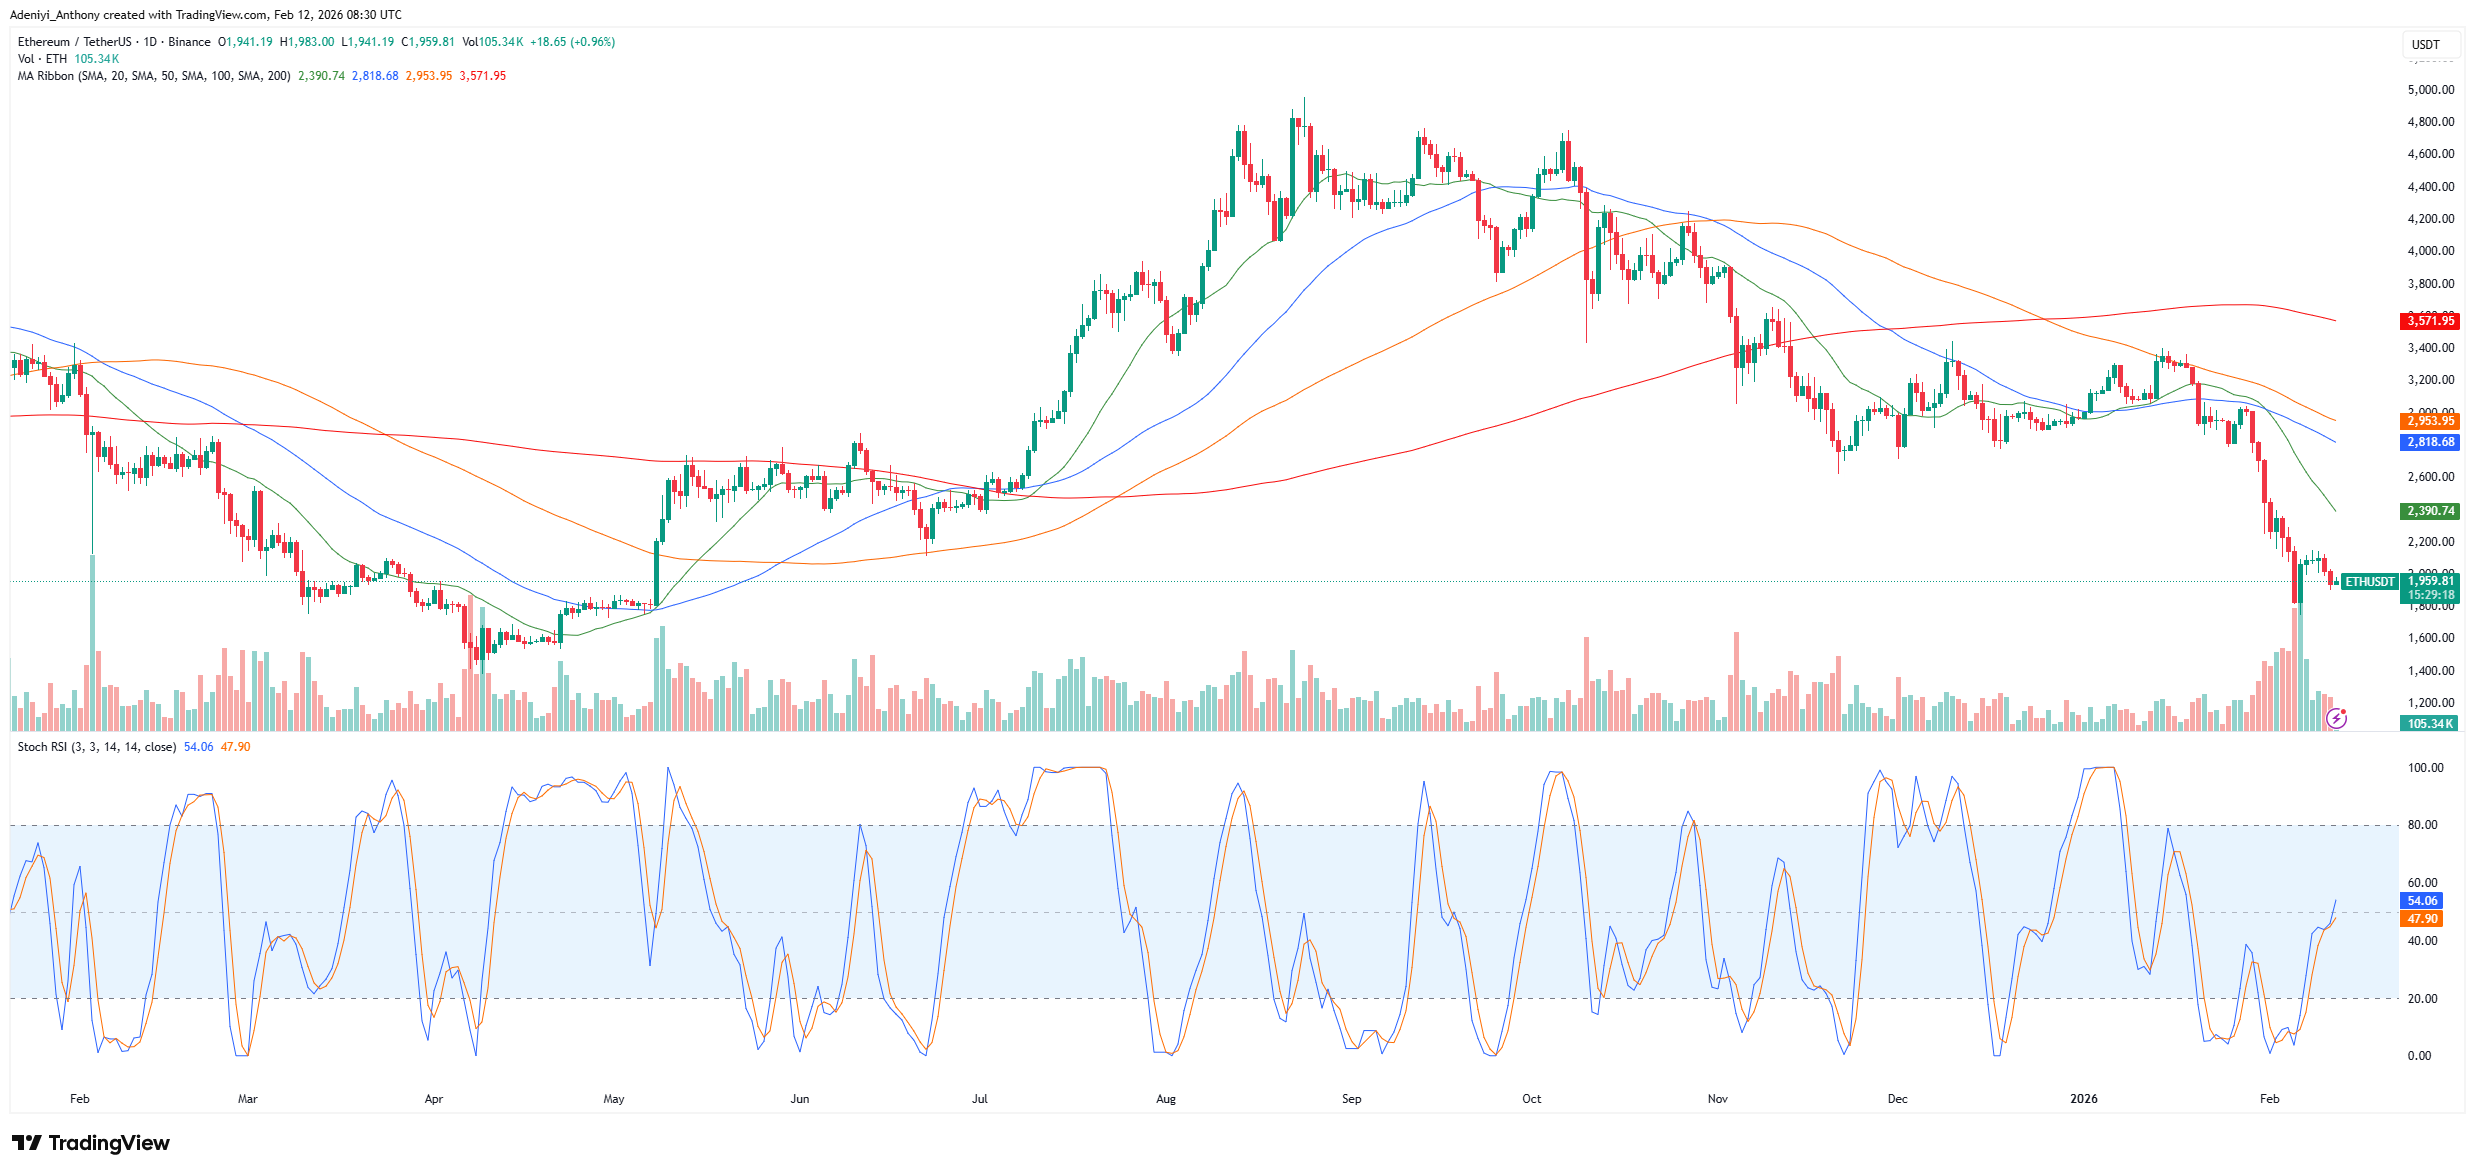
Currently, Ethereum trades at $1,959.81 with more than 105,000 traded volumes on the daily timeframe.
Technical Indicators
Major Resistance Levels: $2,000, $2,390, and $2,850
Major Support Levels: $1,900, $1,850, and $1,700
Technical Analysis
Technically, the Ethereum price is in a sharp downward trend. The token appears on the daily chart to be trading well below its major moving averages (20, 50, 100, 200). At the moment, the recent high volume suggests intense selling pressure. Meanwhile, the Stochastic RSI beneath the chart appears to be rising from oversold levels, indicating a potential V-shaped short-term relief bounce. However, the overall structure remains bearish due to the positioning of the price below the $2,390 short-term moving average.
To this end, even with the recent bullish development, the market remains in a fragile state. However, a break above the 20-day SMA would confirm a bullish setup, but for now, caution is necessary.
Ethereum Elliott Wave Update
Ethereum remains in a selloff mode even with the recent 24% bounce off the 78.6% retracement level. As it stands, the recovery still lacks a clear five-wave impulsive structure without a definitive bottom. Though the move remains speculative until key resistance is broken, the current outlook suggests a potential ABC corrective rally toward $3,500.
From another angle, it appears that a bearish five-wave decline may be forming, risking a drop to the $1,600 area. However, a three-wave corrective move signals that further lows should be the main target of the investors at the moment, as a five-wave impulsive advance would favor a more bullish recovery.
ETH/USDT Analysis: Is Ethereum Ready for a Major Reversal?
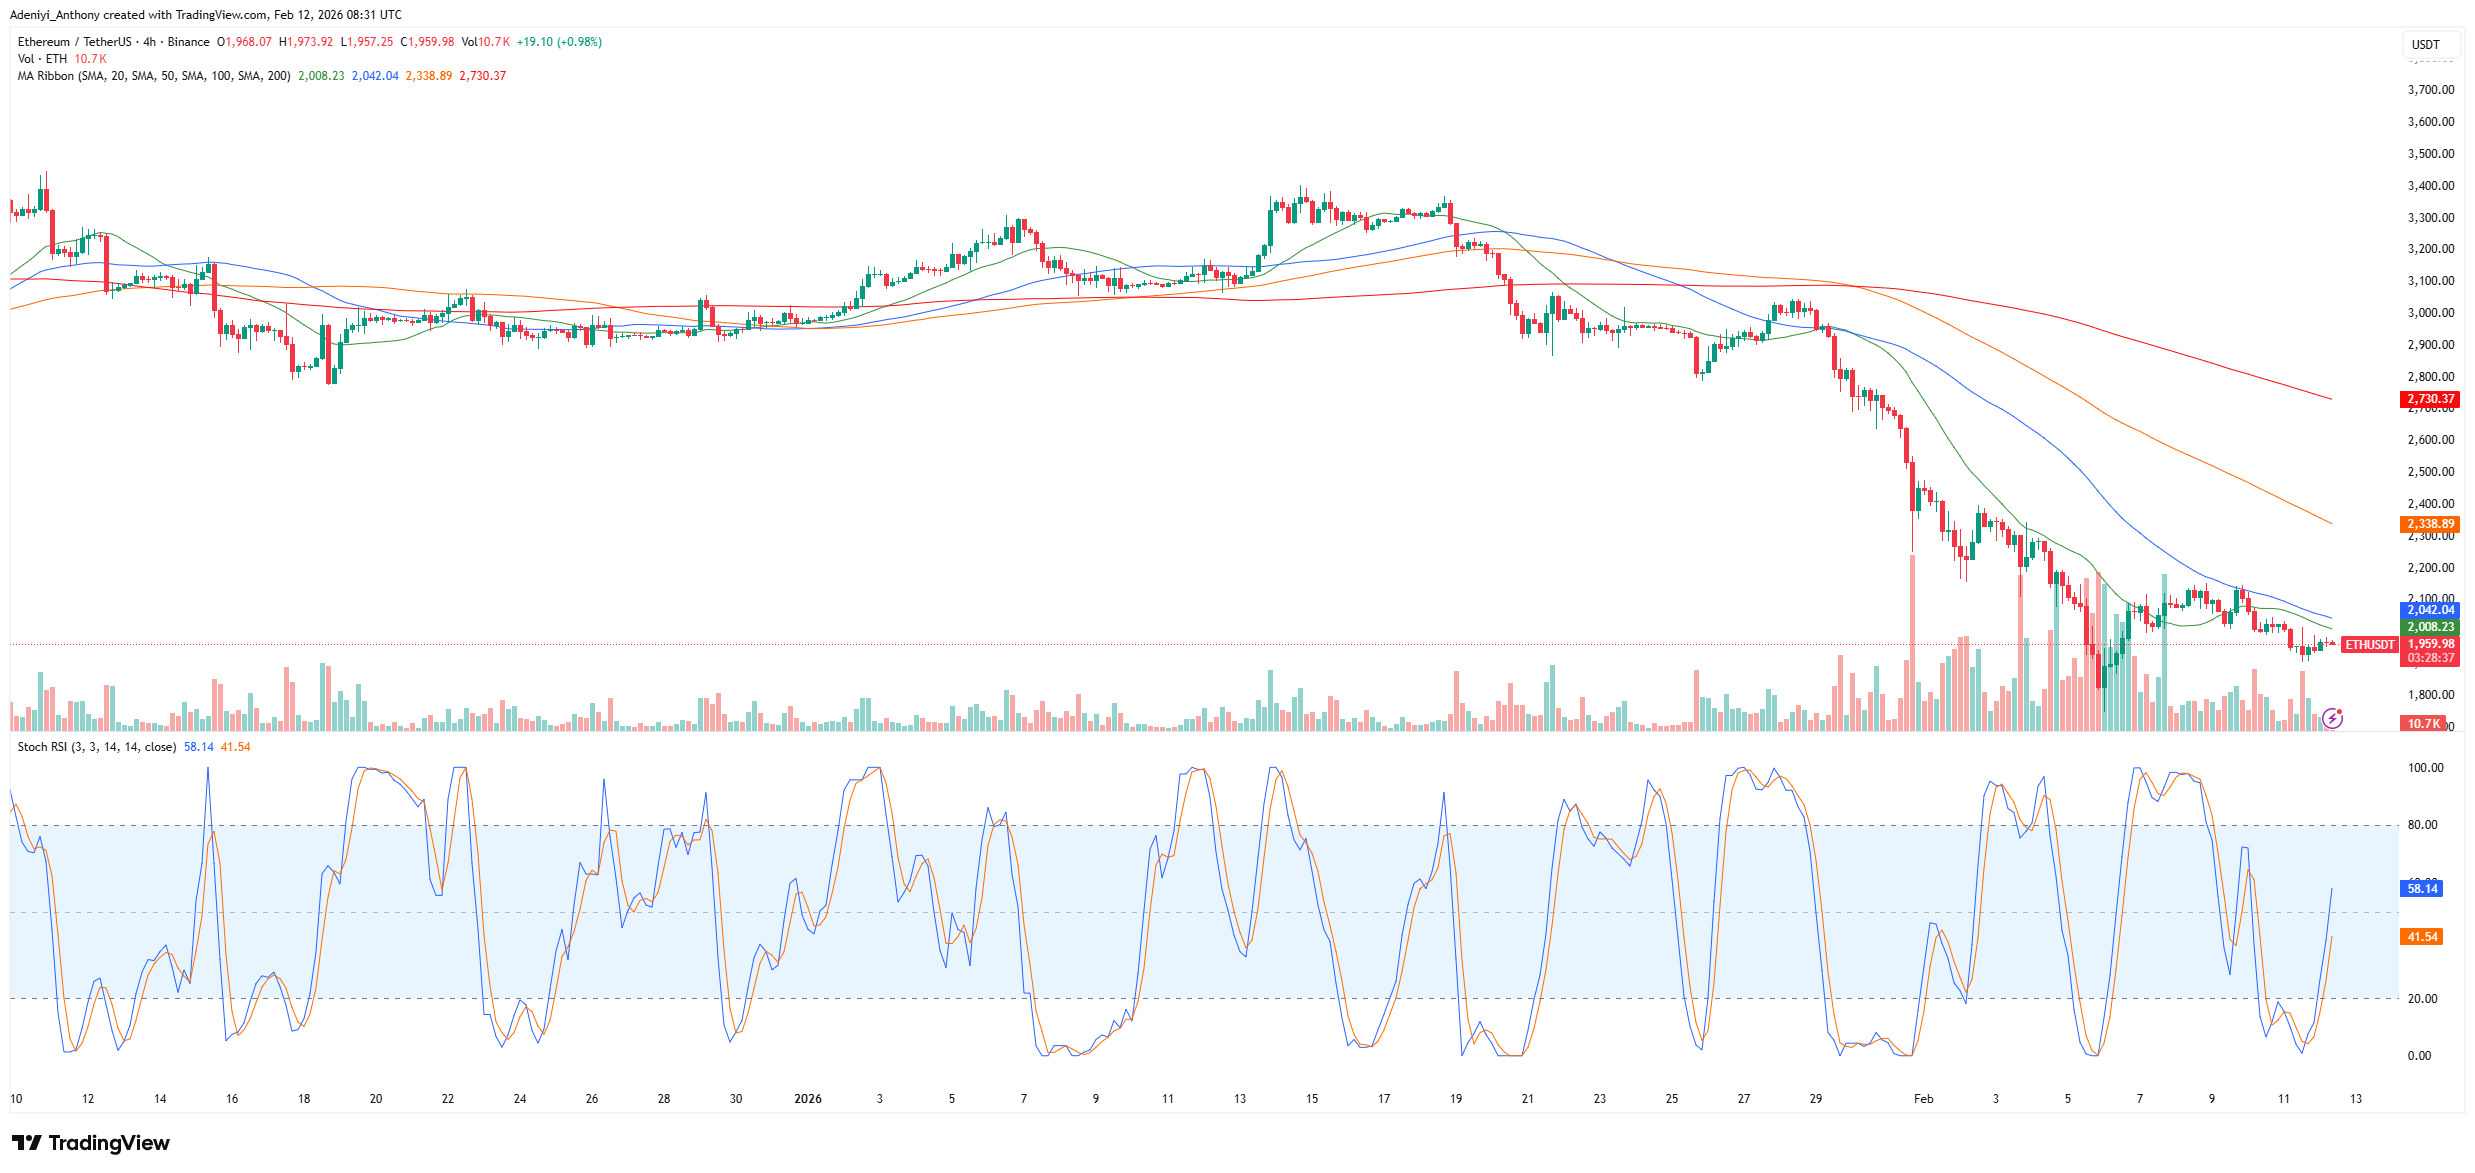
Similar to the daily chart, ETH/USDT on the 4-hour chart is showing a downtrend. The pair has experienced a free fall in the recent session. However, following a dramatic fall, the price action suggests an attempt to recover the short-term 20-period MA while stabilizing close to local lows.
To this end, the Stochastic RSI is suggesting a possible short-term rescue rebound with a bullish from an oversold condition. Meanwhile, the buying volume seems to be low, and the overhead resistance around $2,100 indicates that any upward rise might not last long.
You can purchase crypto coins here. Buy Crypto