Fantom (FTM/USD) Bulls Gallop Toward December 26 Highs, Surpassing $0.4 Mark
Estimated Reading Time: 2 minutes
Don’t invest unless you’re prepared to lose all the money you invest. This is a high-risk investment and you are unlikely to be protected if something goes wrong. Take 2 minutes to learn more
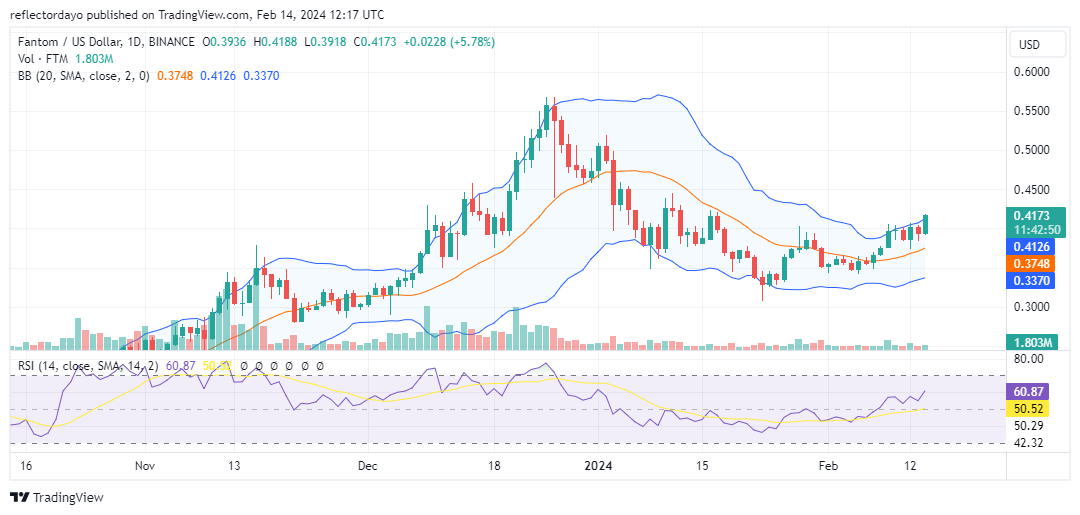
The Fantom bulls established a sturdy foundation near $0.32 around January 24, following a bear market triggered by the December peak of $0.57. With the formation of this support level, bullish momentum countered bearish pressure, resulting in a brief period of price consolidation. Subsequently, bullish traders successfully reinforced a higher support level at $0.35, bolstering the bull market and propelling the price beyond the $0.40 threshold.
Fantom Market Data
- FTM/USD Price Now: $0.417
- FTM/USD Market Cap: $1.2 billion
- FTM/USD Circulating Supply: 69 million
- FTM/USD Total Supply: 2.8 billion
- FTM/USD CoinMarketCap Ranking: #61
Key Levels
- Resistance: $0.43, $0.50, and $0.55.
- Support: $0.35, $0.32, and $0.300.
Fantom Market Analysis: The Indicators’ Point of View
Since the establishment of the initial support level in January at $0.32, the Fantom bulls have consistently achieved higher lows, propelling the bull market towards the December 26 high of $0.57. Today’s daily trading session is characterized by a significant candlestick pattern known as a marubozu. This crypto signal (the marubozu candlestick) suggests that thus far, bullish momentum has dominated the market, facilitating a smooth surge in price beyond the crucial support level of $0.40. Additionally, with the Relative Strength Index (RSI) measuring at the 60 level, there may still be ample room for further action from Fantom bulls.
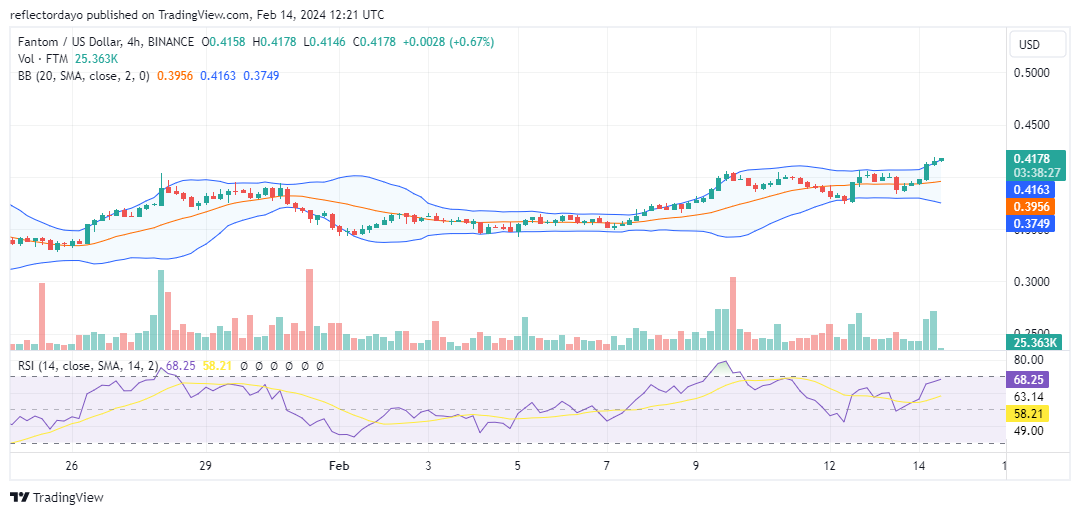
FTM/USD 4-Hour Chart Outlook
During the third 4-hour session, a degree of bearish activity was observed following the market’s ascent to $0.42. However, the bulls swiftly regained control within the same session, indicating their prevailing dominance throughout the day thus far. As the market approaches the $0.45 price level, bullish momentum may potentially diminish as certain traders consider profit-taking opportunities. Nonetheless, historical data suggests limited resistance in this vicinity.