Synthetix (SNXUSD) Makes a New Wave in Response to the Demand Zone
Estimated Reading Time: 2 minutes
Don’t invest unless you’re prepared to lose all the money you invest. This is a high-risk investment and you are unlikely to be protected if something goes wrong. Take 2 minutes to learn more
SNXUSD Analysis – Market Makes a New Wave in Response to the Demand Zone
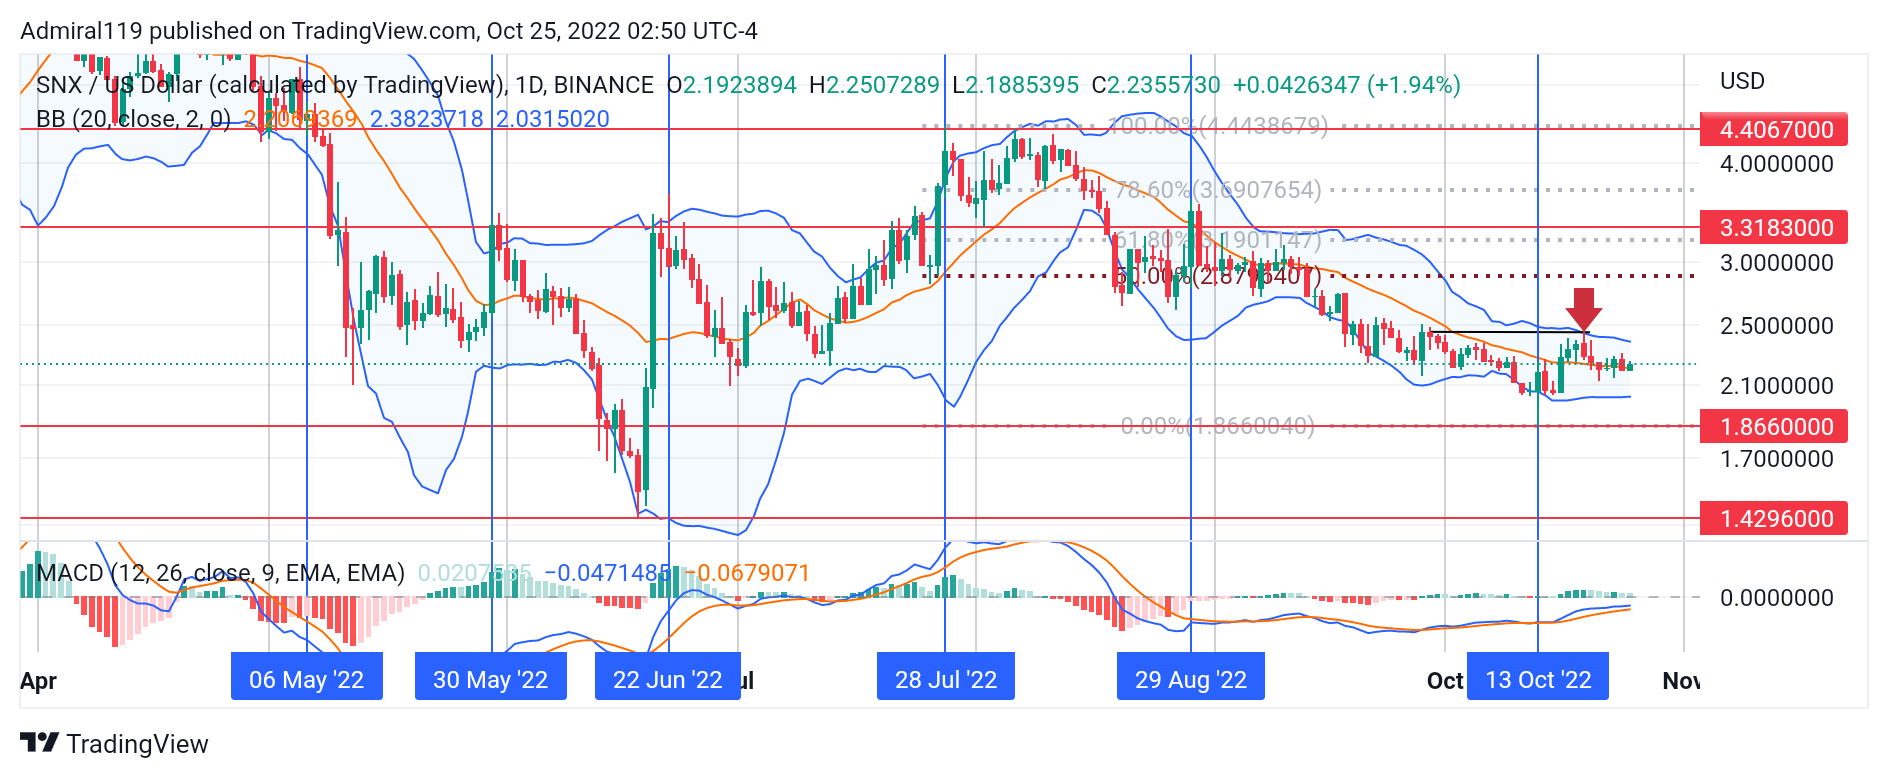
SNXUSD makes a new wave in response to the demand zone at $1.86600. The synthetix market has always been a battleground for bulls and bears. The reason for this is that the daily chart shows no discernible trend, with prices oscillating between premium and discount levels.
SNXUSD Significant Zones
Demand Zones: $1.86600, $1.42960
Supply Zones: $3.31830, $4.40670
On the 6th of May, 2022, an expansion occurred swiftly to the downside. This expansion was due to the effect of the consolidation within the previous support at $4.40670. The price fell further, breaking and retesting the previous support at $3.31830.This retest prompted SNXUSD sellers to place more short orders as the price fell further into the discount. As the market hit the demand level at 1.42960, prices surged upward in less than three days to hit the current $3.31830 supply zone. The bounces off the Bollinger Bands show the struggle between the bears and the bulls in the market.
From the $1.42960 demand zone, the Moving Average Convergence Divergence rallied steadily beyond the zero line alongside the histograms. This indicated that the buyers were in control of the market. But this dominance only lasted till the price hit $4.40670 on the 28th of July, 2022. From the supply zone, SNXUSD began to purge downward in fractals. The Bollinger Bands and the MACD indicators reveal that the current market direction is bearish but with low momentum. The market has resumed its trend to the downside after hitting the rejection block.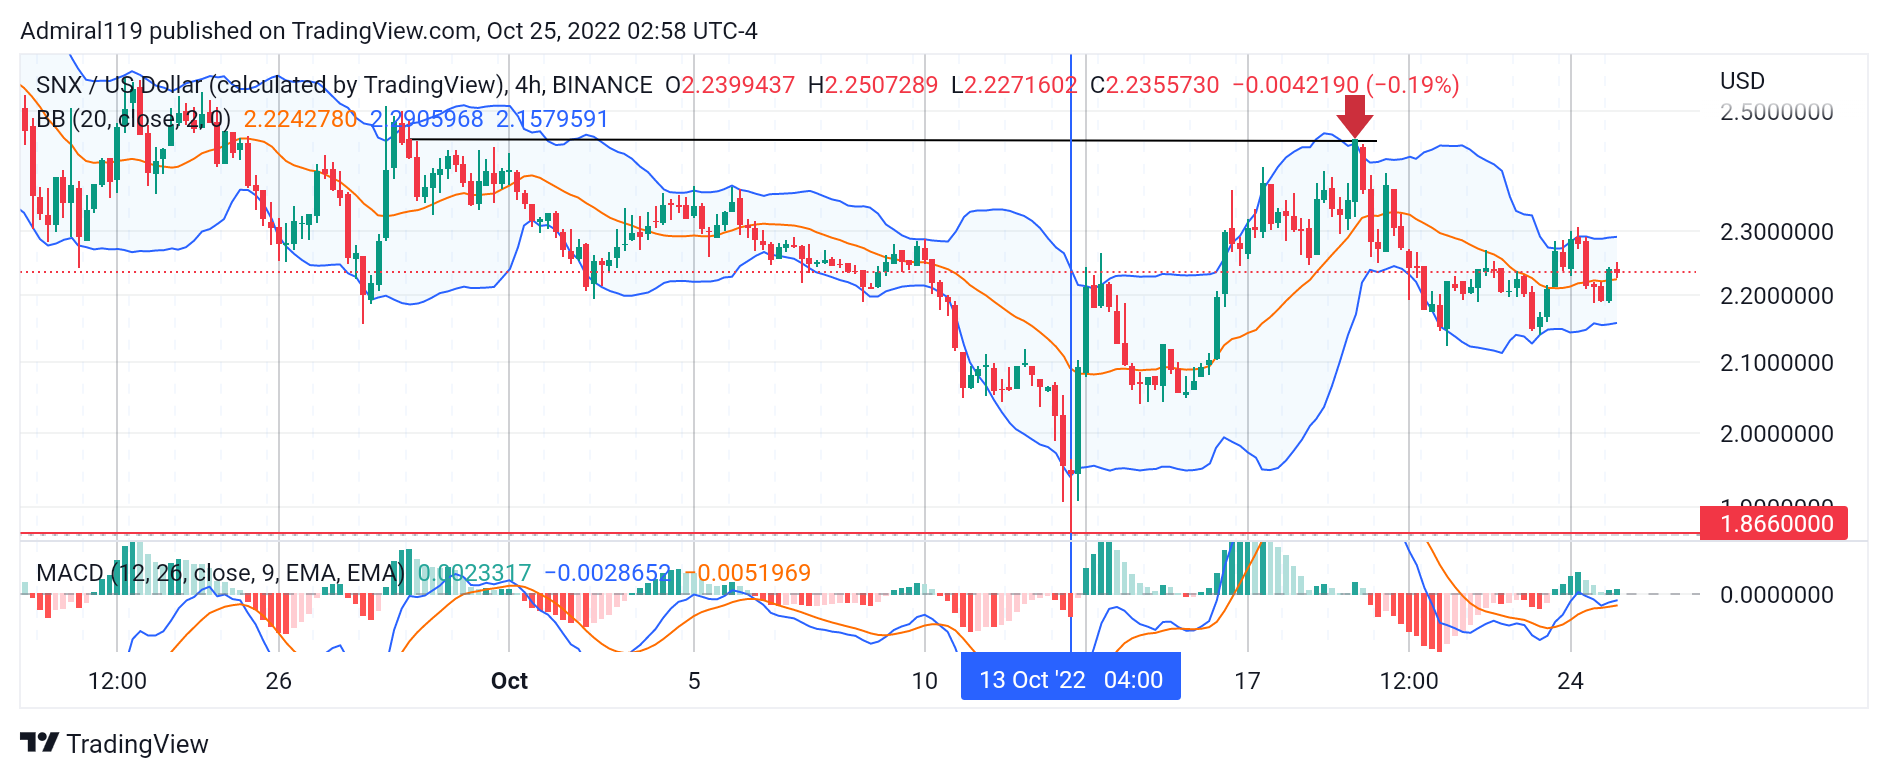
Market Expectation
The four-hour chart currently looks bearish after hitting the daily rejection block. Should this rejection block be invalidated later, SNXUSD might head into the daily premium array before resuming the market trend to the downside.
You can purchase Lucky Block here. Buy LBLOCK
Note: Cryptosignals.org is not a financial advisor. Do your research before investing your funds in any financial asset or presented product or event. We are not responsible for your investing results.