Polkadot (DOT) Rebounds Above $26 Support, Resumes Uptrend
Estimated Reading Time: 2 minutes
Don’t invest unless you’re prepared to lose all the money you invest. This is a high-risk investment and you are unlikely to be protected if something goes wrong. Take 2 minutes to learn more
Polkadot (DOT) Long-Term Analysis: Bullish
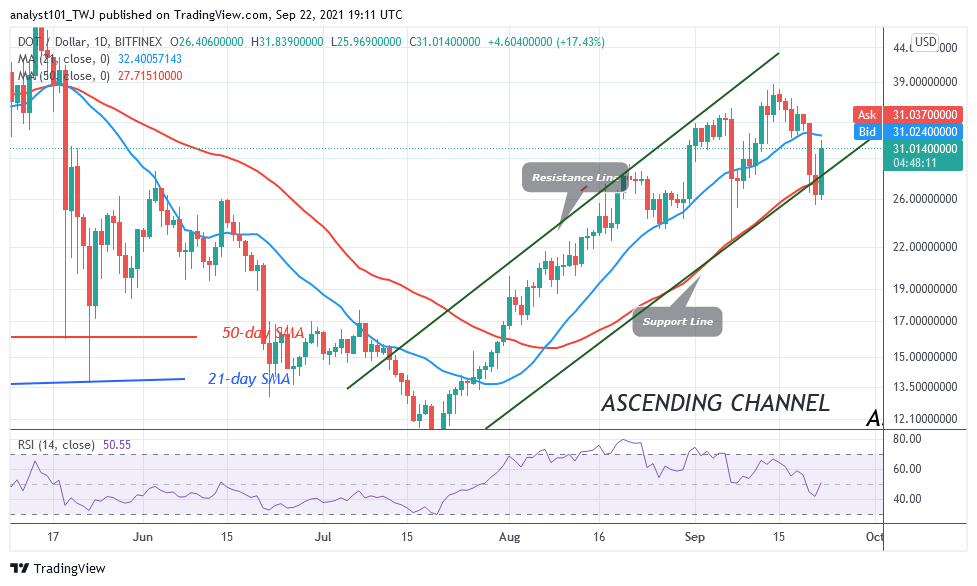
Presently, Polkadot’s (DOT) price has broken above the 50 –day SMA. If the DOT price breaks above the 21-day SMA, the altcoin will be in the bullish trend zone. DOT/USD will rise to retest the $36 high. Presently, the DOT price is rising to the previous highs. If the altcoin faces resistance at the $32 high, the crypto will fall on the downsize. If it falls and breaks below the 50-day SMA, the downtrend will resume.
Polkadot (DOT) Indicator Analysis
The altcoin is at level 51 of the Relative Strength Index period 14. It indicates there is a balance between supply and demand. The 21-day SMA and the 50-day SMA are sloping upward indicating the uptrend. DOT price is now between the 21-day SMA and the 50-day SMA.
Technical indicators:
Major Resistance Levels – $48, $52, $56
Major Support Levels – $32, $28, $24
What Is the Next Direction for Polkadot (DOT)?
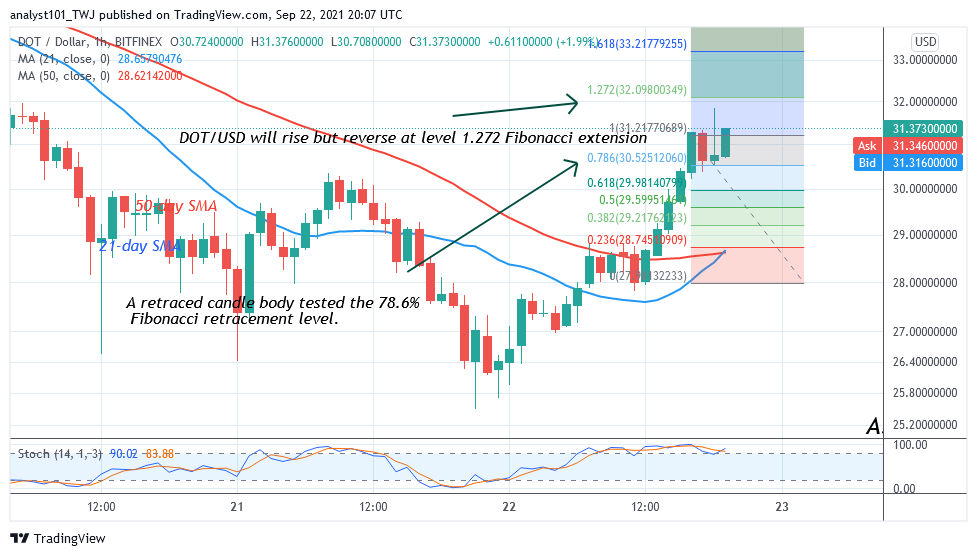
Polkadot is in an upward move but the uptrend is likely to be short-lived. Meanwhile, on the September 22 uptrend, a retraced candle body tested the 78.6% Fibonacci retracement level. The retracement indicates that DOT will rise to level 1.272 Fibonacci extension or level $32.09. From the price action, the market is approaching the recent high.
You can purchase crypto coins here. Buy Tokens
Note: Cryptosignals.org is not a financial advisor. Do your research before investing your funds in any financial asset or presented product or event. We are not responsible for your investing results