Fantom (FTM/USD) Secures Strong Upward Momentum, Targets Key Resistance Levels
Estimated Reading Time: 3 minutes
Don’t invest unless you’re prepared to lose all the money you invest. This is a high-risk investment and you are unlikely to be protected if something goes wrong. Take 2 minutes to learn more
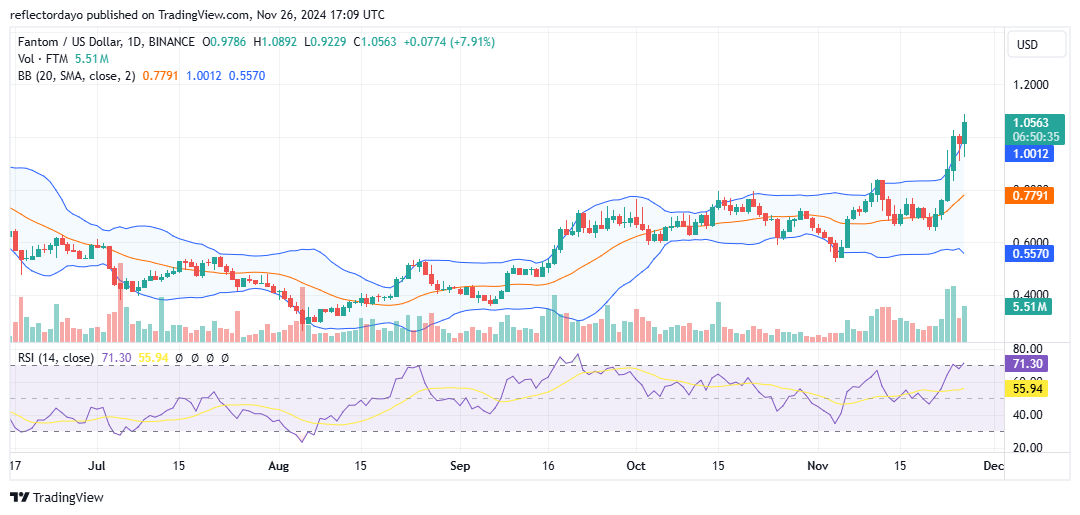
Over the past two to three days, the Fantom market has experienced a significant price surge driven by substantial buying activity. This momentum allowed the market to effortlessly surpass the $0.84 resistance level, gaining further upward traction and breaking through the critical $1.00 price threshold.
At present, the Fantom market remains above the $1.00 level, with bullish sentiment continuing to dominate despite the recent surge and rapid upward momentum.
The Fantom Market Data
- FTM/USD Price Now: $1.0691
- FTM/USD Market Cap: $3 billion
- FTM/USD Circulating Supply: 2.8 billion
- FTM/USD Total Supply: 3.2 billion
- FTM/USD CoinMarketCap Ranking: #45
Key Levels
- Resistance: $1.10, $1.11, and $1.20
- Support: $1.00, $0.90, and $0.80.
The Fantom Market Through the Lens of Indicators
The recent bullish surge has prompted some profit-taking, as evidenced by the upper shadow on today’s bullish candlestick. Despite this, bullish sentiment continues to outweigh bearish sentiment. While the bulls currently dominate the market, attention should remain on the $1.00 price level due to the ongoing market correction.
Prospective investors should monitor for a consolidation of bullish momentum around the $1.00 level and a potential rebound from this support zone. However, the market’s heightened volatility, signaled by the widening Bollinger Bands, suggests the possibility of erratic price swings in the crypto market.
Over the past two to three days, the Fantom market has experienced upside volatility driven by strong bullish momentum. If this trend persists, the bulls may still have an opportunity to sustain the upward trajectory.
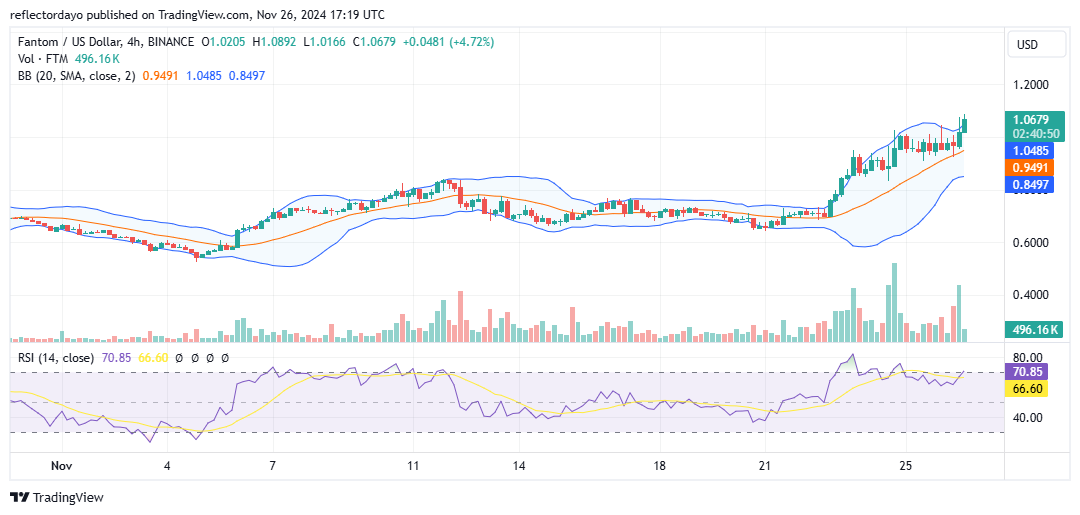
FTM/USD Price Prediction: 4-Hour Chart Analysis
The 4-hour chart provides an optimistic outlook, suggesting that the market may sustain its position above the critical $1.00 price level. The adjustment of the Bollinger Bands to accommodate this market shift further confirms the potential for stability above this key level.
However, the upper shadows on the last two candlesticks indicate that a resistance level could be nearby. Traders should take this into account, as the downward bounce from the $1.088 resistance level highlights the presence of bearish bias in this area. Careful monitoring of these dynamics will be crucial for informed decision-making.