Hyperliquid (HYPE/USDT) Bearish Momentum Builds as Price Struggles at Key Resistance
Estimated Reading Time: 3 minutes
Don’t invest unless you’re prepared to lose all the money you invest. This is a high-risk investment and you are unlikely to be protected if something goes wrong. Take 2 minutes to learn more

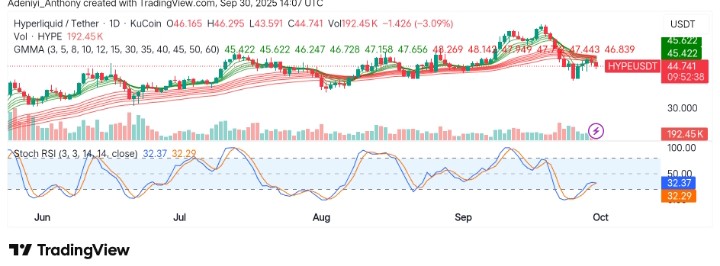
The market for Hyperliquid against Tether has shown no exception to the mixed signals provided in the general crypto market. Despite recent gains, the pair’s price appears to have encountered resistance near the $46.50 mark, signaling a potential bearish reversal.
On the flip side, the Stochastic RSI seems to be leaving the oversold zone, indicating a potential decrease in the selling pressure. To this end, this signal suggests market momentum may be shifting, indicating a reversal, but a break above $46.50 is needed to confirm a bullish structure.
Currently, Hyperliquid trades at $44.741 with more than 192 thousand traded volumes for the day.
Technical Indicators
Major Resistance Levels: $46.50, $47.00, and $48.00
Major Support Levels: $43.50, $42.00, and $40.50
Hyperliquid Technical Analysis
In the past few days, Hyperliquid against Tether has technically repeatedly tested immediate resistance, failing to move towards $47.00. Now, the price appears to be forming lower highs, building bearish pressure as the operation of the coin stays within the Guppy Multiple Moving Averages (GMMA).
To this end, the Stochastic RSI signals that there might be a move to the north in the near term, but the traded volumes for the day appear to be low, and a move below $42.00 would signal further downside.
Permissionless spot quote assets are live on mainnet. Stable asset deployers can enable quote asset status, subject to the onchain requirements outlined in the Docs.
Any quote asset can be specified as the quote asset in the first spot pair of an HIP-1 deployment. Additional…
— Hyperliquid (@HyperliquidX) September 28, 2025
However, despite the current downtrend, a lot of activities have been going on within the ecosystem. @Hyperliquidx recently disclosed to the members of the public the introduction of permissionless spot quote assets, which are now live on mainnet.
This will enable stable asset deployers to quote asset status with more features to come in the future.
HYPE/USDT Analysis: Facing Increasing Pressure
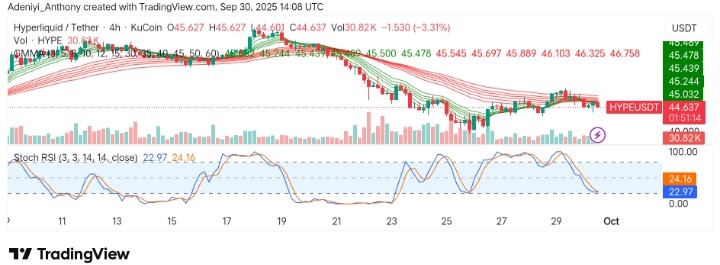
On the 4H chart, there has been increasing selling pressure, with the price breaking support levels.
On one hand of the analysis, the Stochastic RSI is currently in the oversold territory at 22.97, indicating potential for a rebound if buying momentum increases. However, the price is still facing an obstacle around the $45.50 mark, reinforcing a bearish short-term outlook.
On the other hand, the volume appears to be decreasing, and the GMMA is also sloping downward, suggesting a lack of strong buying pressure. To this end, if the price fails to reclaim $45.50, further downside could be expected, especially if it breaches $44.50. Meanwhile, a move above $45.24 will reignite buying pressure.
You can purchase crypto coins here. Buy Crypto