Hyperliquid (HYPE/USDT) Displays Bearish Trend Amid Declining Volume
Estimated Reading Time: 3 minutes
Don’t invest unless you’re prepared to lose all the money you invest. This is a high-risk investment and you are unlikely to be protected if something goes wrong. Take 2 minutes to learn more

In the last 24 hours, the market for Hyperliquid against Tether has dropped by 7.78%, performing below the 1.21% losses experienced within the broader space. As it stands, the concern about the token unlock of $2.2 million has raised fears. Additionally, the ongoing transition to nature USDE on the HyperEVM also poses potential short-term liquidity risks as the technical indicators tend south.
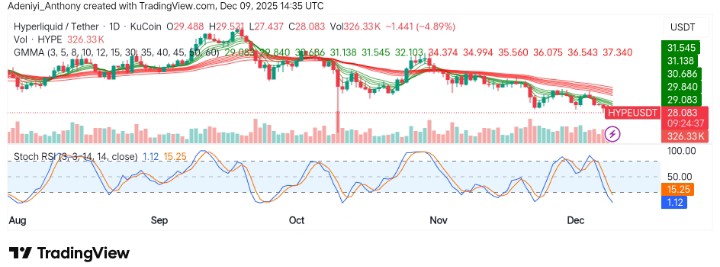
Currently, Hyperliquid trades at $28.083 on the daily chart with more than 326,330 traded volume already.
Technical Indicators
Major Resistance Levels: $29.52, $30.62, and $32.00
Major Support Levels: $27.43, $26.00, and $25.00
Technical Analysis
Technically, Hyperliquid against Tether is showing a clear downtrend, extending to the south as the price consistently moves below the $30.00. As it stands, the Guppy Multiple Moving Averages (GMMA) is indicating a bearish trend as the sets of EMAs point south. Additionally, it appears that the Stochastic oscillator is operating in the oversold region with a potential reversal sign, although confirmation is needed.
🎯 $HYPE 4h Finora AI Analysis
Bearish momentum dominates, price below key resistances.
Testing resistance: 29.10 → 31.45📍 Entry zone: 27.50-27.70 (wait for confirmation)
🎯 Target: 24.00-24.50
🛑 Invalidation: Above 27.70
Current bias: SHORT 🔴Complete… pic.twitter.com/ubcgmOv5y9
— Finora – Your AI Trade Buddy (@Finora_EN) December 9, 2025
Meanwhile, @Finora_X has highlighted a bearish momentum as the price remains below key resistance levels. At the moment, the analyst reveals the token is currently testing $29.10, and a fall below the current level would indicate a move towards $25.00. Conclusively, the trader also points to the fact that a move above $27.70 would invalidate the analysis.
HYPE/USDT Analysis: Gearing Up for Further Downside
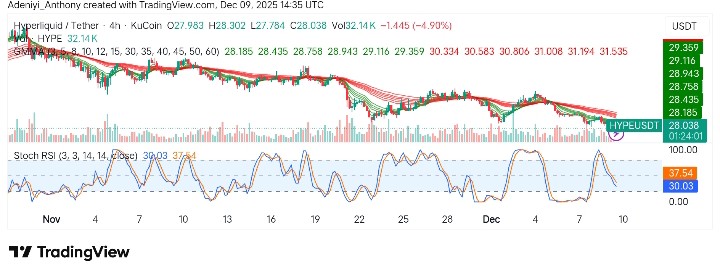
On the 4-hour timeframe, HYPE/USDT appears to be on a downtrend, as on the daily chart. The divergence of the GMMA suggests the current dip may not be fully over. Furthermore, the Stochastic RSI in this timeframe is displaying that there might be more room to the south as the lines bend from the north.
Meanwhile, the short-term volume indicator suggests buying momentum may be increasing, suggesting a correction might occur before further decline.
To this end, it is possible that the pair may extend to the south towards $25.00 in the meantime, unless a move above $29.00 is seen.
You can purchase crypto coins here. Buy Crypto