Hyperliquid (HYPE/USDT) Faces Major Pullback Amidst Continued Market Pressure
Estimated Reading Time: 3 minutes
Don’t invest unless you’re prepared to lose all the money you invest. This is a high-risk investment and you are unlikely to be protected if something goes wrong. Take 2 minutes to learn more

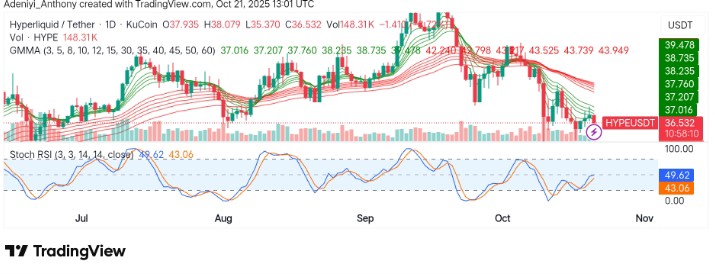
Hyperliquid against Tether has shown a clear downtrend with significant bearish momentum, as the price continues to fall below resistance bands. On the smaller timeframe it has been observed that a similar pattern of weakness exists with bullish momentum as the price struggles to regain previous highs.
Meanwhile, from another angle, the momentum oscillator across the market suggests the bears are controlling the direction of the price as pressure increases.
Currently, Hyperliquid trades at $36.532, recording more than 148.3 thousand traded volumes for the day.
Technical Indicators
Major Resistance Levels: $37.760, $43.739, and $42.240
Major Support Levels: $35.370, $34.000, and $33.000
Technical Analysis
Technically, Hyperliquid against Tether has recently broken through key support levels, showing consistent lower lows. Additionally, the price action suggests that bears are in control, with the moving averages further confirming a strong bearish trend. As it stands, the Stochastic RSI on this timeframe appears to be forming a straight line with moving, indicating that the price may consolidate anytime soon.
To this end, if bullish momentum fails to reclaim the $37.760-$42.240 region, sell pressure will keep pushing the price lower.
$HYPE: The price is now testing resistance in the $39.72 – 47.38 zone. The sell-off that was expected happened within one hour last Friday. It was not expected so fast, but completed potentially the yellow (c) wave. pic.twitter.com/SH1x0X3ifR
— More Crypto Online (@Morecryptoonl) October 15, 2025
@Morecryptoonline has opined that Hyperliquid is testing the $39-$47 resistance zone and that the major sell-off took place some days ago. Though this is not expected, the token still operates under the same limit.
HYPE/USDT Analysis: Short-Term Reversal Possible as Support Levels Face Test
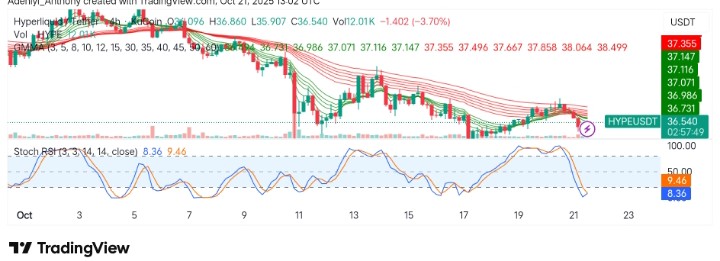
On the 4-hour chart, HYPE/USDT appears to be in the $35.907 support zone as the price is currently oscillating around it. Meanwhile, the GMMA seems to be displaying bearish divergence; a break below this support would signal further bearish pressure, while a bounce could provide an opportunity for a small upside move. However, the Stochastic RSI suggests that the token appears to be recovering from the oversold region; a display of a bullish crossover would signal the start of a move to the north.
You can purchase crypto coins here. Buy Crypto