Hyperliquid (HYPE/USDT) Faces Strong Resistance at Key Moving Averages
Estimated Reading Time: 3 minutes
Don’t invest unless you’re prepared to lose all the money you invest. This is a high-risk investment and you are unlikely to be protected if something goes wrong. Take 2 minutes to learn more

The market for Hyperliquid against Tether in the last 24 hours has fallen 9.5%, underperforming the general market bearish sentiment. Meanwhile, the key identifiable factors for this fall in value include leveraged long liquidations, the downside activity below $28.1, and the failed ETF filling process.
Meanwhile, the indicators on the chart suggest a continuation of the downward trend, with the price failing to break above vital simple moving averages. To this end, bearish market sentiment is dominant as the price remains in the $20 range.
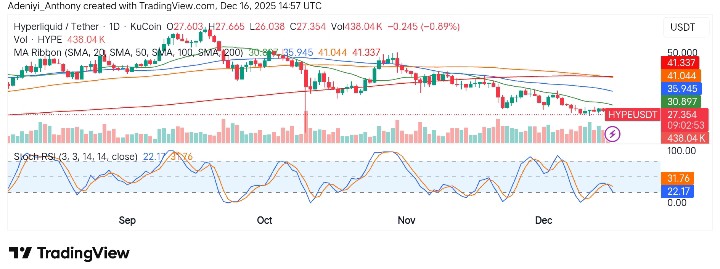
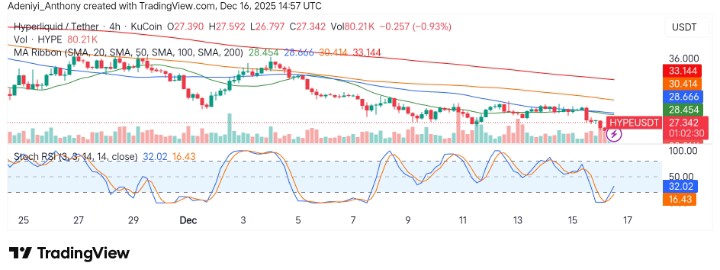
Currently, Hyperliquid trades at $27.35 with over 438,000 volume on the daily timeframe.
Technical Indicators
Major Resistance Levels: $30.893, $35.944, and $41.337
Major Support Levels: $26.00, $25.00, and $24.00
Technical Analysis
Technically, Hyperliquid against Tether appears to be trending downward on the daily chart. The price action below the important moving averages shows that selling pressure is on the increase as the price tends to test the immediate support level.
Additionally, the Stochastic RSI appears to be nearing the oversold region with no sign of an impending shift in momentum.
To this end, since the volume indicates continued selling pressure, a move towards $25 may be seen soon, but an increase in bullish participation may change the whole analysis.
Update on Hyperliquid
Hyperliquid appears to be displaying a distributive rounded top mapped out by two fair value gaps around $30 and $22. As it stands, the token seems to be experiencing a lack of strength, with the possibility of hitting $22 before a move to the north.
HYPE/USDT Analysis: Is Short-Term Relief Possible?
On the smaller timeframe, especially the 4H chart, HYPE/USDT shows the price is currently at a potential and crucial turning point around the $27 level. This is evident from the fact that the Stochastic RSI appears to be recovering from the oversold zone.
However, a closer look at the positioning of the price and the moving averages shows that they are still acting as a strong resistance around the $28 level.
To this end, if the current momentum fails to continue above the neutral zone, a move into the $26 zone may be noticed, but for now, the pair increases in the short run.
You can purchase crypto coins here. Buy Crypto