Litecoin (LTC) Price Prediction: LTC/USDT Bears Are Regaining Control
Estimated Reading Time: 2 minutes
Don’t invest unless you’re prepared to lose all the money you invest. This is a high-risk investment and you are unlikely to be protected if something goes wrong. Take 2 minutes to learn more
Date: October 21, 2025
The Litecoin market has been relatively subdued after price action dipped sharply from the resistance at the $125 price level. More recently, price behavior suggests that the market is once again under bearish pressure.
Key Price Levels
Resistance: $95, $100, $105
Support: $90, $85, $80
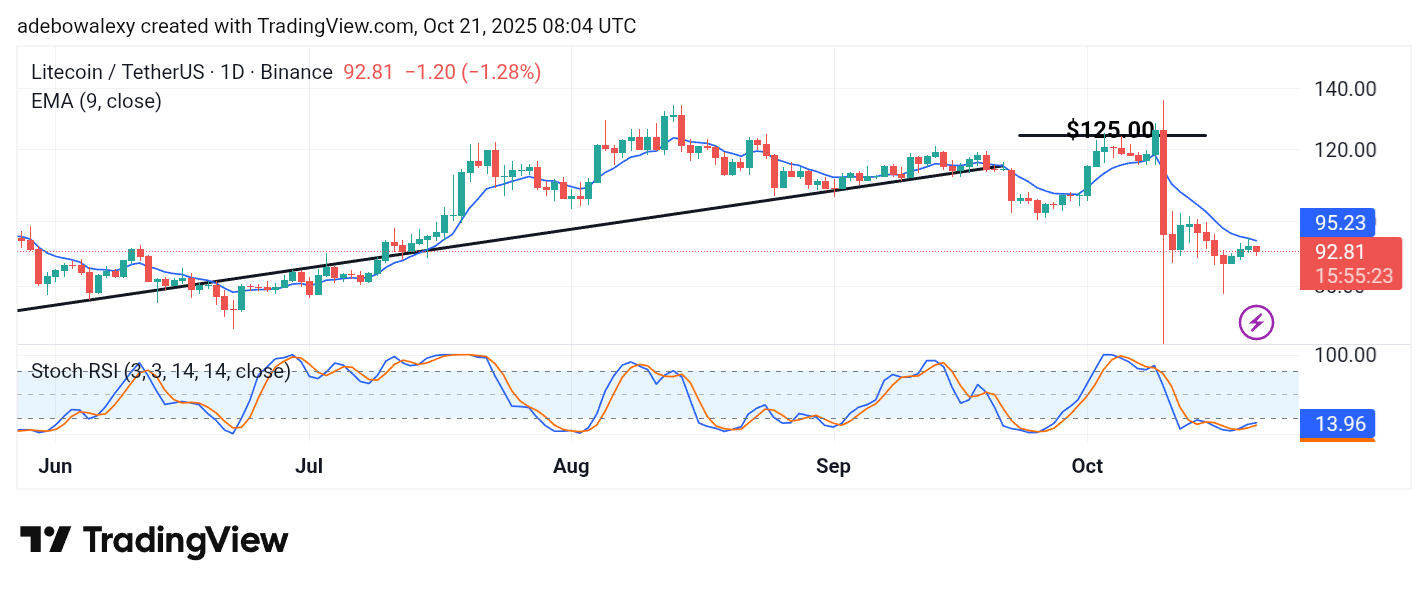
The Litecoin price action has been notably bearish of late. This is evident as the latest price candle for the ongoing session appears red. Meanwhile, recent price candles have remained below the 9-day Exponential Moving Average (EMA) line. Similarly, the lines of the Stochastic Relative Strength Index (SRSI) indicator are positioned in the oversold region, though they show a slight upward movement. However, these lines remain close together as they rise gradually, reflecting the modest price increases seen over the past three sessions.
Litecoin (LTC) Price Prediction: LTC/USDT Shies Away From the 9-Day EMA
The Litecoin market has experienced slight upward movement over the past three sessions. However, in the ongoing session, price action appears to be bouncing off the 9-day EMA curve, keeping the token trading below this technical level.
The lines of the SRSI indicator also show a mild upward direction, but they remain within the oversold region. This continues to place significant pressure on bullish momentum in this market. Therefore, traders may still need to exercise caution.
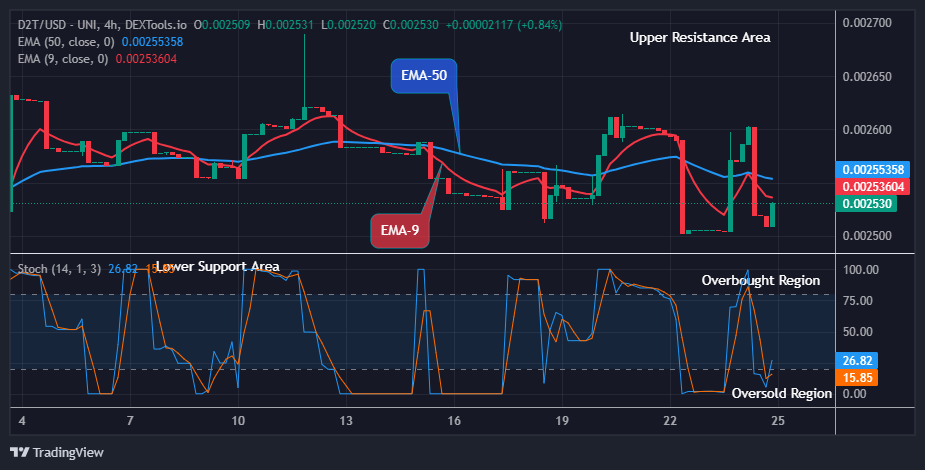
Litecoin (LTC) Price Prediction: LTC/USDT Re-enters Bearish Domain (4-Hour Chart)
On the 4-hour chart, Litecoin appears to have once again slipped below the 9-day EMA curve. The most recent price candle on this chart is red, signaling continued bearish sentiment.
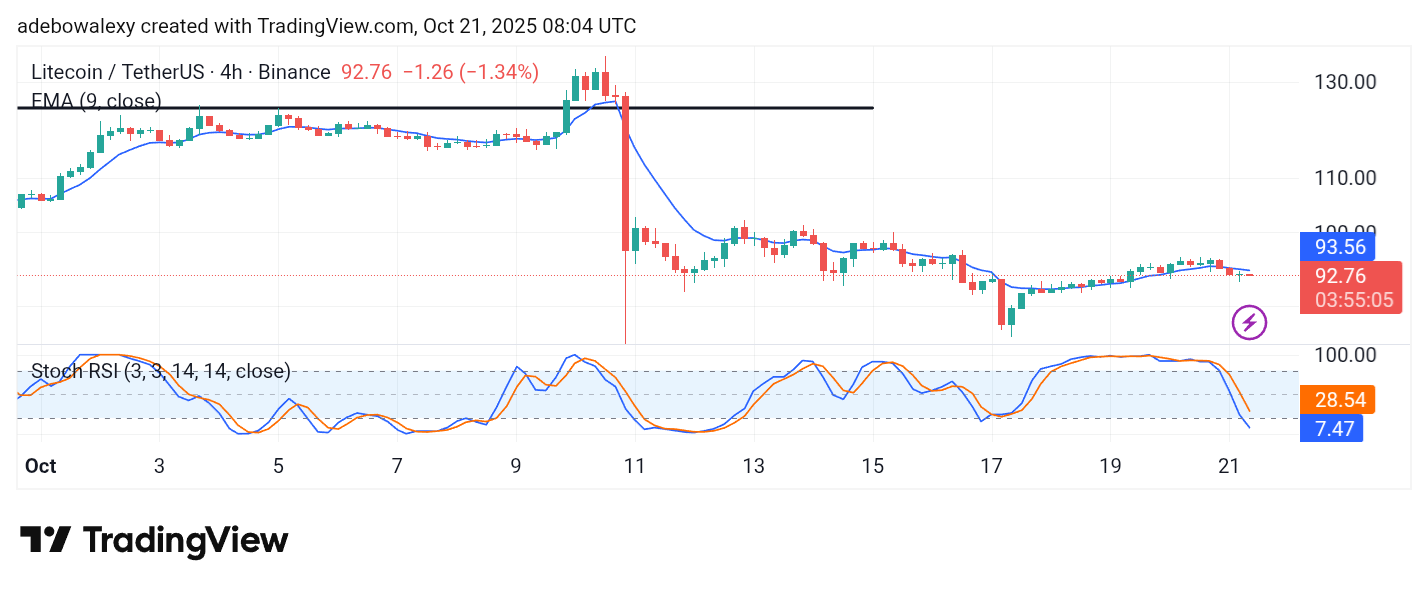
Upon inspection, price action has also become increasingly compressed since the previous session. Meanwhile, the lines of the SRSI indicator have descended rapidly into the oversold region, even amid only a modest price decline.
Therefore, a potential short-term bounce may occur, pushing the market slightly upward toward the $100 price level.