Litecoin (LTC) Price Prediction: LTC/USDT Hits the $100 Target
Estimated Reading Time: 3 minutes
Don’t invest unless you’re prepared to lose all the money you invest. This is a high-risk investment and you are unlikely to be protected if something goes wrong. Take 2 minutes to learn more

Date: October 28, 2025
The Litecoin market has been able to extend its upside recovery until it hit the $100 mark. This move is occurring in tandem with the ongoing price recovery in the Bitcoin market. At this point, the token may experience even more price growth in subsequent trading sessions.
LTC/USDT Long-Term Trend — Bullish (Daily Chart)
Key Price Levels
Resistance: $110, $115, $120
Support: $100, $95, $90
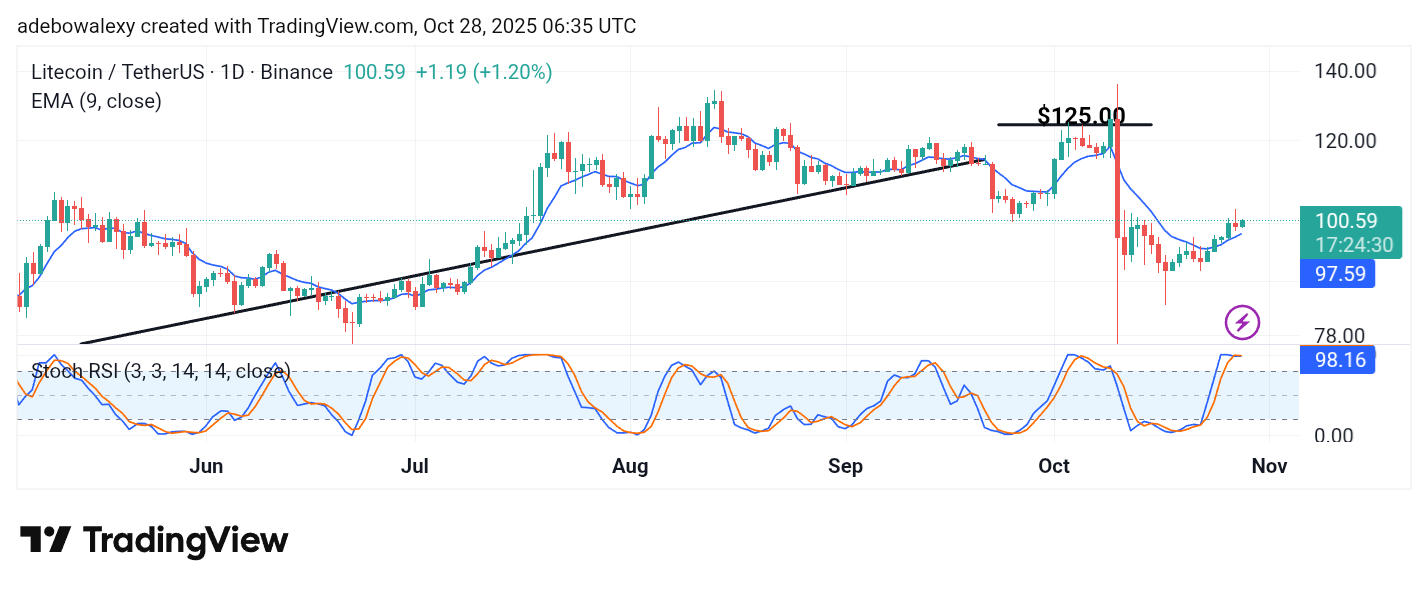
Litecoin’s price action has moved past the 9-day Exponential Moving Average (EMA) curve. The ongoing session is represented on the token’s daily chart by a green price candle. This follows the appearance of a small red price candle in the previous session. Meanwhile, the Stochastic Relative Strength Index (SRSI) indicator lines have reached high into the overbought region. However, despite this, the lines of the indicator are not crossing downward but continue sideways around the 98 level.
Litecoin (LTC) Price Prediction: LTC/USDT Bullish Outlook Stands but May See Friction
The Litecoin market still maintains the technical footing needed to sustain its upward movement. The ongoing session has snapped out of the downward correction seen in the previous session, occurring above the 9-day EMA line.
As such, this suggests that buyers remain optimistic. However, the fact that the SRSI lines have reached the overbought region indicates that bulls may face some challenges ahead. Unless the broader crypto market continues to strengthen, upside progress may become more difficult.
Litecoin (LTC) Price Prediction: LTC/USDT Maintains an Upward Trajectory (4-Hour Chart)
The Litecoin market on the 4-hour chart retains its upward focus as price action resurfaces above the 9-day EMA curve following a recent dip below it over the past four sessions.
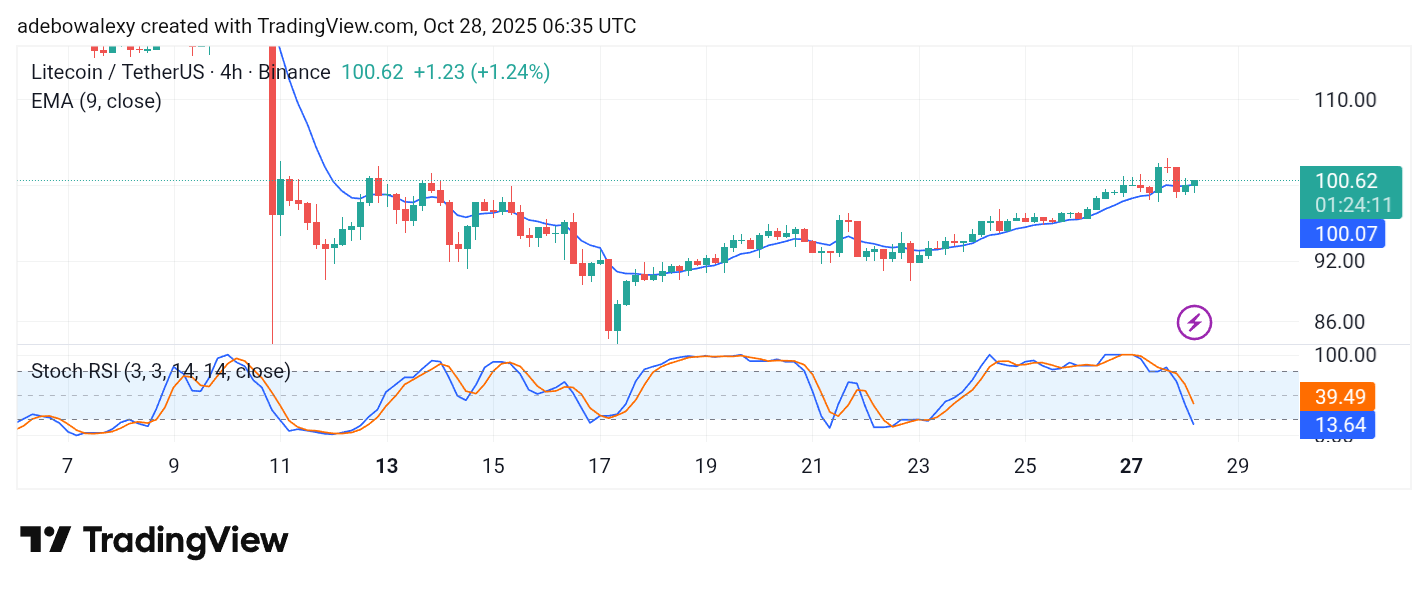
This recovery began in the previous session, and the ongoing session has continued the trend, bringing the coin to trade above the 9-day EMA once again.
Meanwhile, the SRSI indicator lines have started descending within the overbought region. At this point, traders may take confidence in the fact that prices are now positioned above the 9-day EMA curve, supporting a continued bullish outlook toward the $110 price level.