Litecoin (LTC) Price Prediction: LTC/USDT Retraces Downward Off the $110 Resistance
Estimated Reading Time: 2 minutes
Don’t invest unless you’re prepared to lose all the money you invest. This is a high-risk investment and you are unlikely to be protected if something goes wrong. Take 2 minutes to learn more

Date: November 11, 2025
The Litecoin market has seen a fair upward recovery over the past few sessions on the token’s daily chart. However, the market has recently lost some bullish momentum, as price action now trends downward toward a key psychological support level.
LTC/USDT Long-Term Trend — Bearish (Daily Chart)
Key Price Levels
Resistance: $105, $110, $115
Support: $100, $95, $90
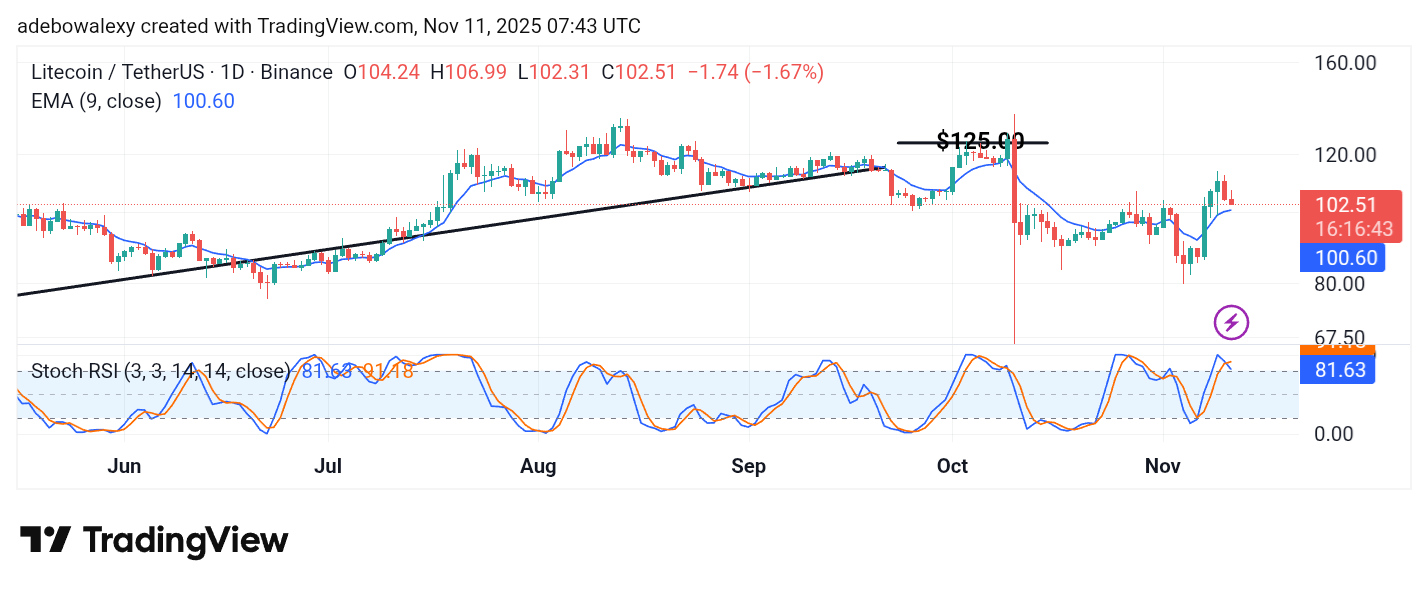
On the Litecoin daily chart, price action reversed direction after hitting the $110 resistance level. The ongoing session has maintained a downward trajectory, though the token remains above the 9-day Exponential Moving Average (EMA) line.
As price action inches closer to testing support near the 9-day EMA curve, the Stochastic Relative Strength Index (SRSI) indicator lines have formed a downward crossover above the 80 mark, signaling potential weakness in bullish momentum.
Litecoin (LTC) Price Prediction: LTC/USDT Eyes Nearby Support
The last two price candles on the Litecoin daily chart have been bearish. However, as of the time of writing, the token remains trading above the 9-day EMA curve. The SRSI indicator lines are still positioned above the 80 mark but have completed a bearish crossover.
The lines of the SRSI remain relatively flat, suggesting that bearish strength is not yet dominant. Therefore, traders might anticipate a potential upward rebound from around the 9-day EMA curve.
Litecoin (LTC) Price Prediction: LTC/USDT Targets the $100 Mark (4-Hour Chart)
On the 4-hour chart, price action appears to have undergone a bearish test. However, the latest price candle shows a rebound off the 9-day EMA curve.
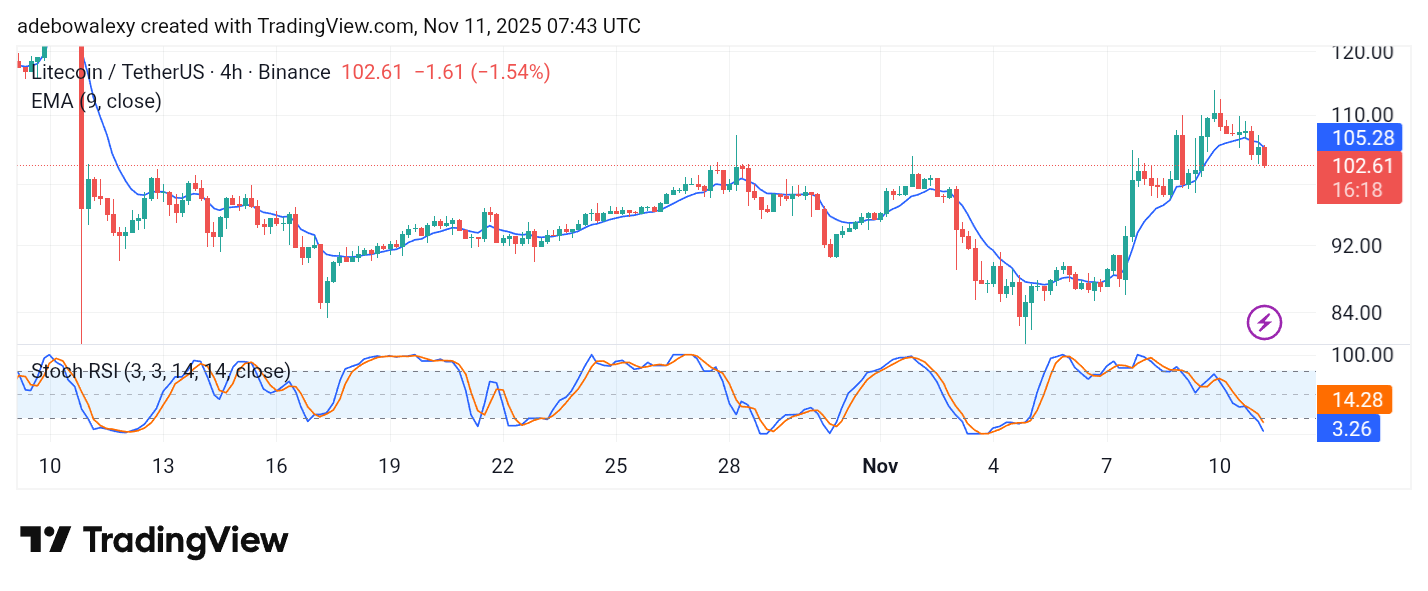
Similarly, the SRSI indicator lines continue to dip into the oversold region. The leading line is around the 3.26 level, while the lagging line remains near 14.28 on the indicator.
Consequently, it appears that this market is heading toward the $100 price level. Traders may target this area for potential short-term bearish gains.