Litecoin (LTC) Price Prediction: LTC/USDT Heads Strongly South
Estimated Reading Time: 2 minutes
Don’t invest unless you’re prepared to lose all the money you invest. This is a high-risk investment and you are unlikely to be protected if something goes wrong. Take 2 minutes to learn more
Date: November 4, 2025
As Bitcoin heads toward the $100,000 support level, most altcoins — including Litecoin — have experienced a wave of bearish corrections. The Litecoin market has witnessed a strong and sharp downturn, bringing the token to trade below the $90 price mark.
LTC/USDT Long-Term Trend — Bullish (Daily Chart)
Key Price Levels
Resistance: $110, $115, $120
Support: $100, $95, $90
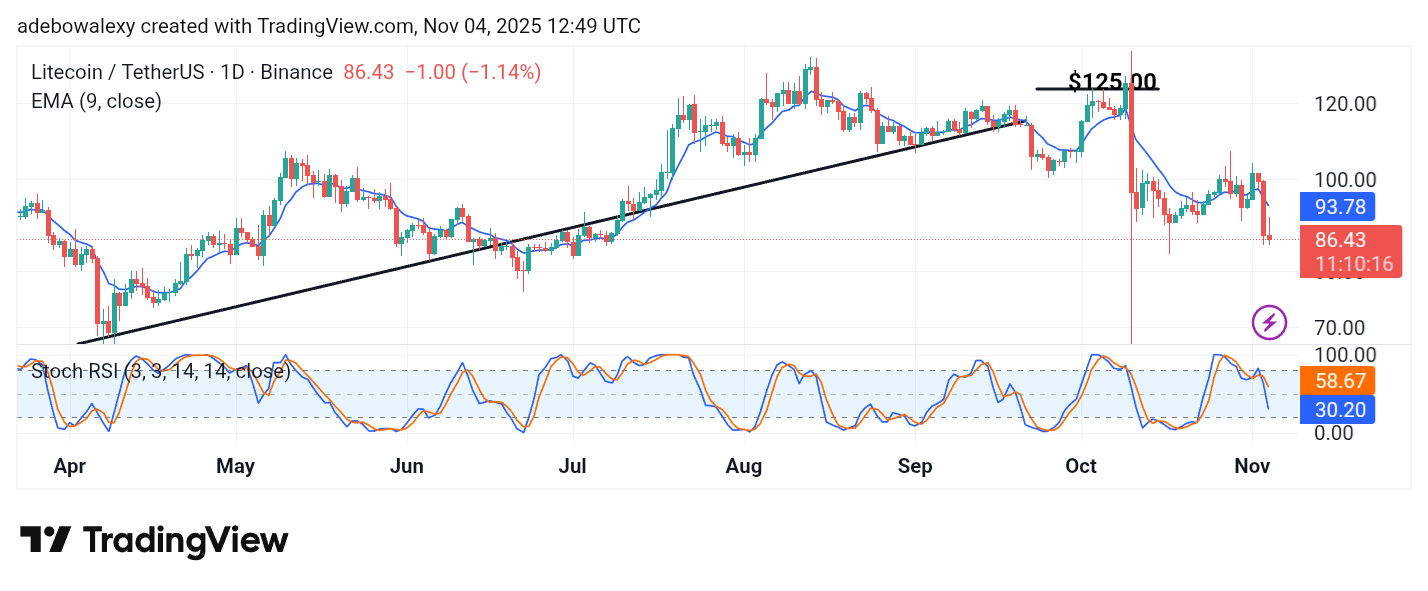
As of the time of writing, the Litecoin market can be seen rebounding slightly from its upside track through the $100 price level. The latest price candle remains red and is positioned below the 9-day Exponential Moving Average (EMA) line. At the same time, the Stochastic Relative Strength Index (SRSI) indicator lines are dipping steeply into the oversold region. The lead line of the indicator is positioned significantly ahead of the lagging one.
Litecoin (LTC) Price Prediction: LTC/USDT Maintains Bearish Potential
Price action in the Litecoin market continues to head toward lower levels. The latest price candle is red, suggesting that bearish pressure remains strong. Its position below the 9-day EMA further reinforces the bearish sentiment.
However, a closer examination of the candle reveals an active struggle in the ongoing session. The candle displays visibly large upper and lower shadows, suggesting a compression phase. The trajectory of the SRSI still indicates that bears remain dominant. As such, the market appears likely to maintain its downward course.
Litecoin (LTC) Price Prediction: LTC/USDT Appears Set for More Price Declines (4-Hour Chart)
In the Litecoin 4-hour chart, price action has continued in the red, even across shorter time frames. The most recent candle has returned the market to a bearish path following a brief upside deflection in the previous session.
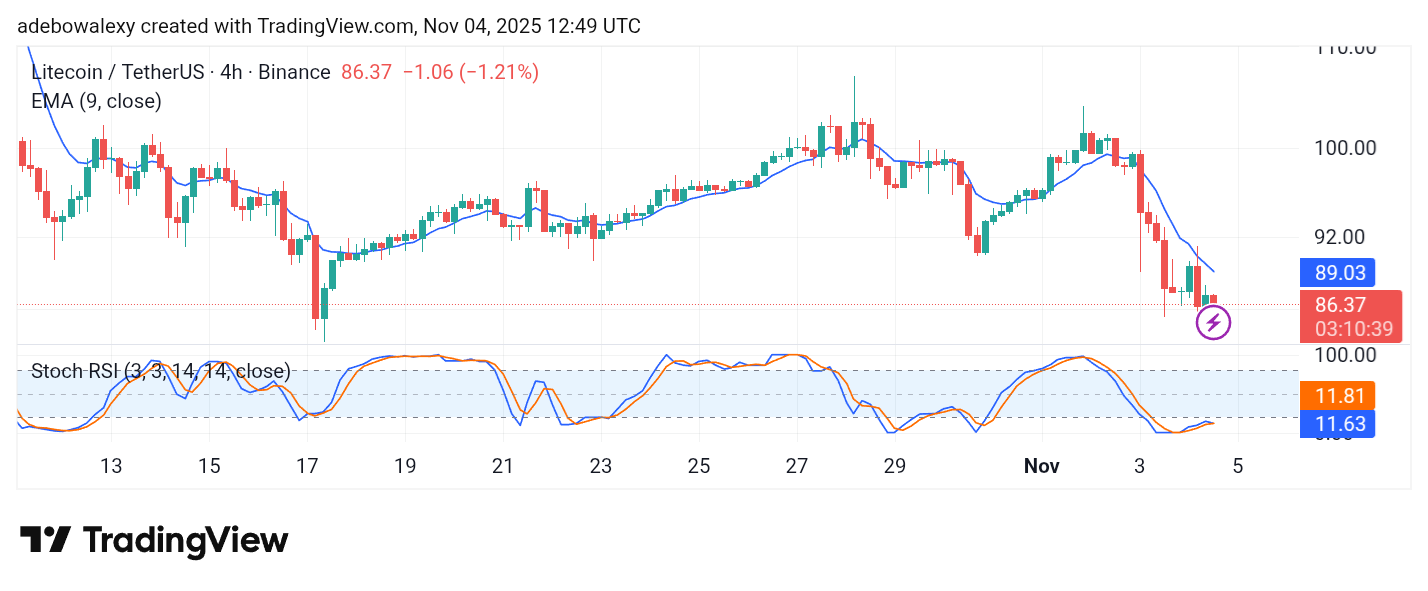
Price activity also remains below the 9-day EMA curve. The SRSI indicator still lies within the oversold region, with its terminal lines merged and showing a sideways movement — a sign of market hesitation. Consequently, this suggests that downward forces are likely to persist and may push the market toward the $80 mark.