Litecoin (LTC) Traders Anticipate a Bullish Market
Estimated Reading Time: 3 minutes
Don’t invest unless you’re prepared to lose all the money you invest. This is a high-risk investment and you are unlikely to be protected if something goes wrong. Take 2 minutes to learn more

Summary:
- LTC remains bullish above the 9-day EMA.
- MACD supports continued upward momentum.
- Price may rally toward $55.
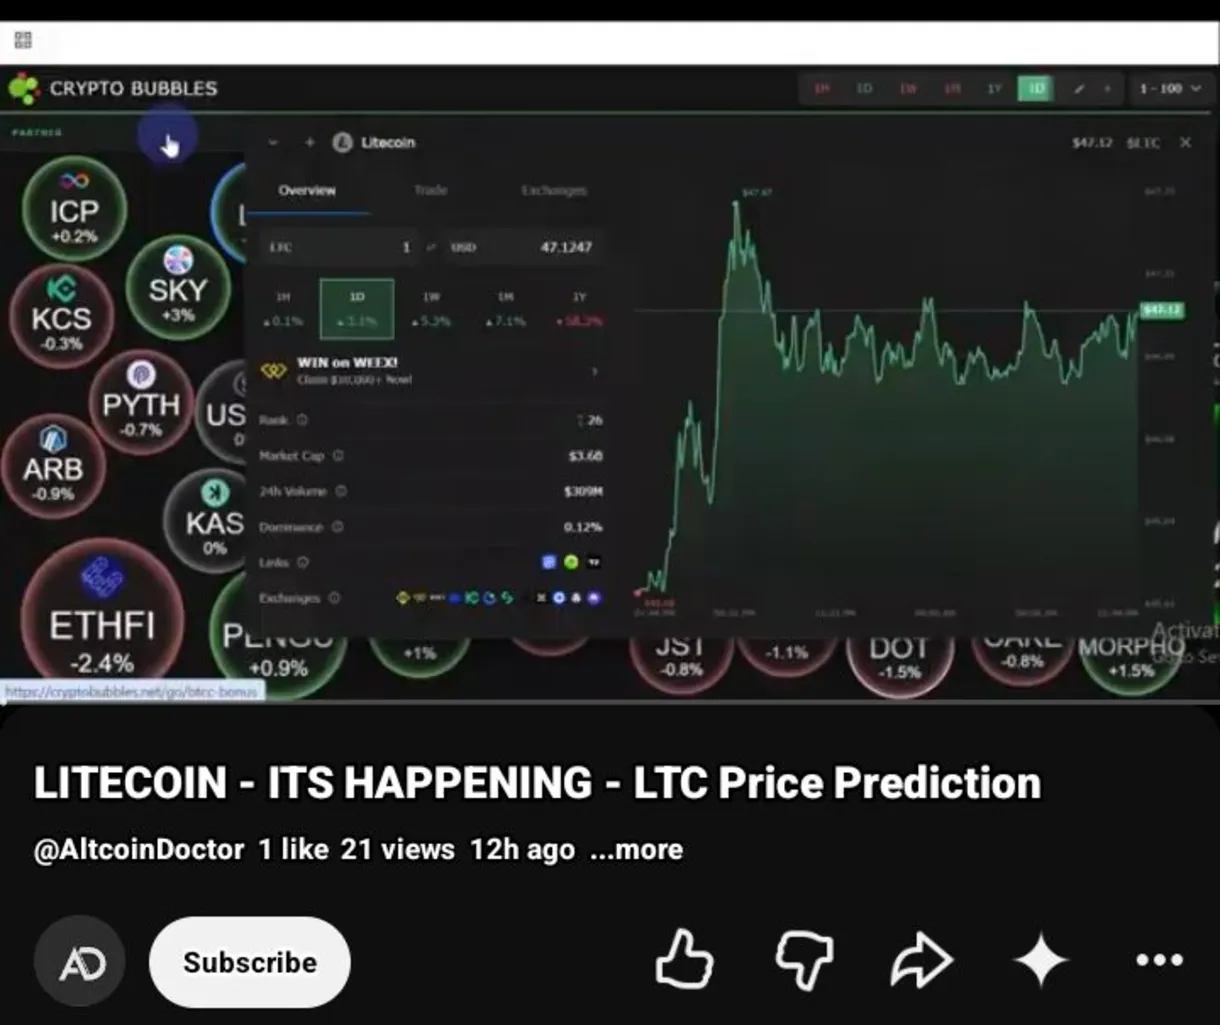
While technical indicators surrounding Litecoin suggest that bullish momentum remains in control, market sentiment is also aligning with this outlook. The market is currently trading at around $47, holding above a key technical support level. The coin has gained more than 6.5%, and further upside may still be on the horizon.
Litecoin on the Daily Chart
Looking at the LTC/USDT daily chart, it is clear that bullish momentum remains dominant. Although the latest candlestick is bearish, it continues to trade above the 9-day Exponential Moving Average (EMA).
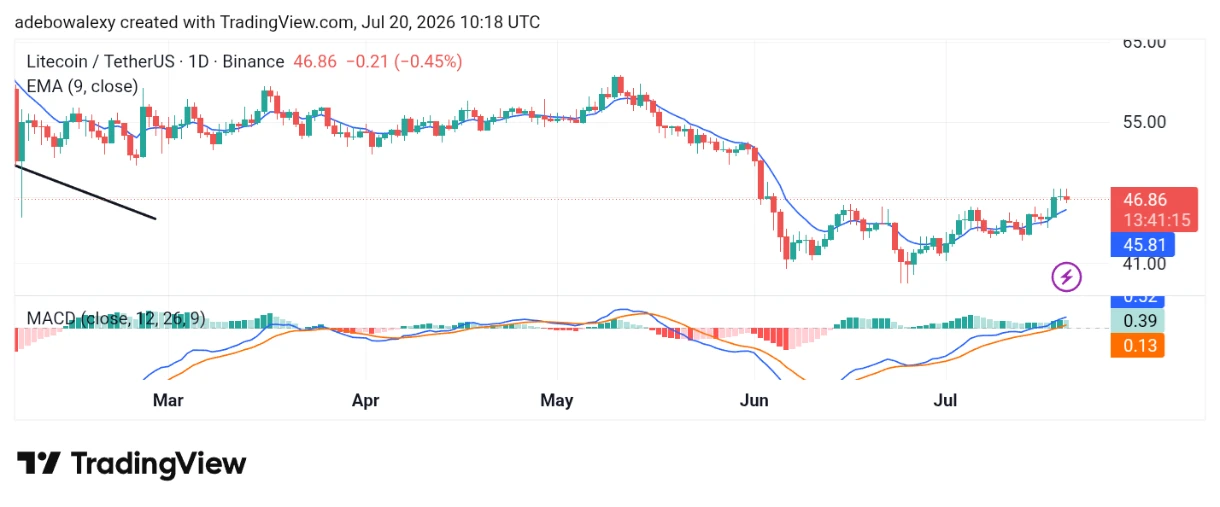
Likewise, the Moving Average Convergence Divergence (MACD) indicator has crossed above the equilibrium level. In addition, the MACD histogram bars are now printing above the zero line, although the latest bar has turned light green, reflecting a slight slowdown in bullish momentum during the current session.
LTC/USDT Sees a Bearish Pullback but Remains on Course
A modest bearish pullback Today’s Litecoin market on the daily chart shows a modest bearish pullback. in today’s Litecoin market on the daily chart. Nevertheless, price action continues to hold above the 9-day EMA, indicating that buyers still maintain the upper hand and may continue pushing prices higher.
At the same time, the MACD lines remain above the equilibrium level. Although the histogram bars have turned light green, they are still positioned above the zero line, suggesting that bullish momentum remains intact. Consequently, the overall market outlook continues to favor the bulls.
Litecoin May See a Significant Recovery Soon
A closer look at Litecoin’s recent price movement reveals a steady upward trend. This has been particularly evident since the market rebounded from the $41 support level.
Even now, price action remains above the 9-day EMA, as shown by the latest candlestick on the chart. This suggests that the market remains well-positioned for further gains. Therefore, traders may continue to target the $55 price level if bullish momentum persists.