BNB Stabilizes as It Recoups Above $540
Estimated Reading Time: 2 minutes
Don’t invest unless you’re prepared to lose all the money you invest. This is a high-risk investment and you are unlikely to be protected if something goes wrong. Take 2 minutes to learn more

BNB (BNB) Long-Term Analysis: Bearish
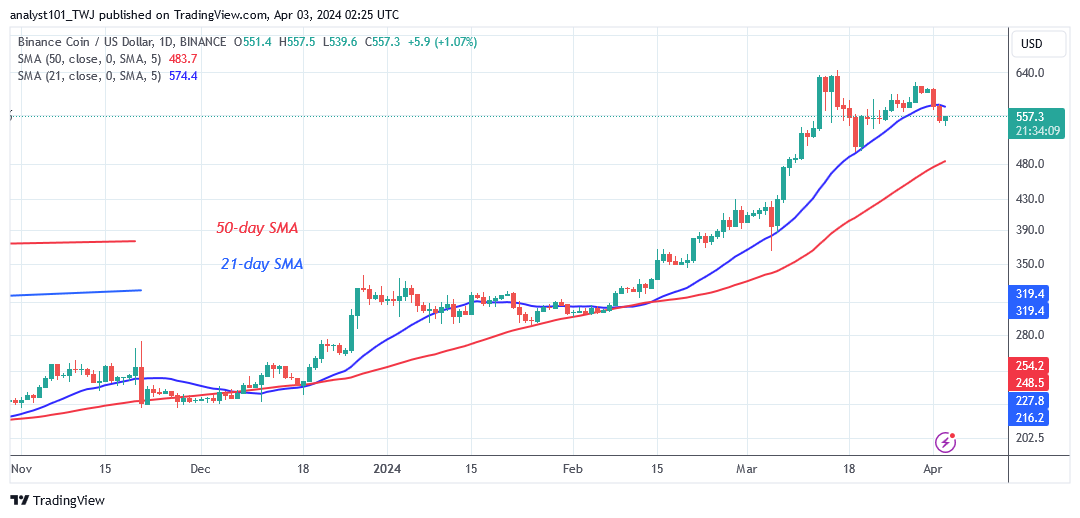
BNB’s price has fallen below the 21-day SMA as it recoups above $540. Buyers have been unable to maintain the price above the $645 high. BNB would have surged beyond the $700 overhead resistance. Currently, the bears have grabbed control of the price. The altcoin will drop even more if the negative momentum is sustained, and it will decline above the 50-day SMA. However, if bulls buy the present fall, BNB will rise above the 21-day SMA. BNB/USD is now worth $558.50.
Technical indicators:
Major Resistance Levels – $600, $660, $720
Major Support Levels – $400, $340, $280
BNB (BNB) Indicator Analysis
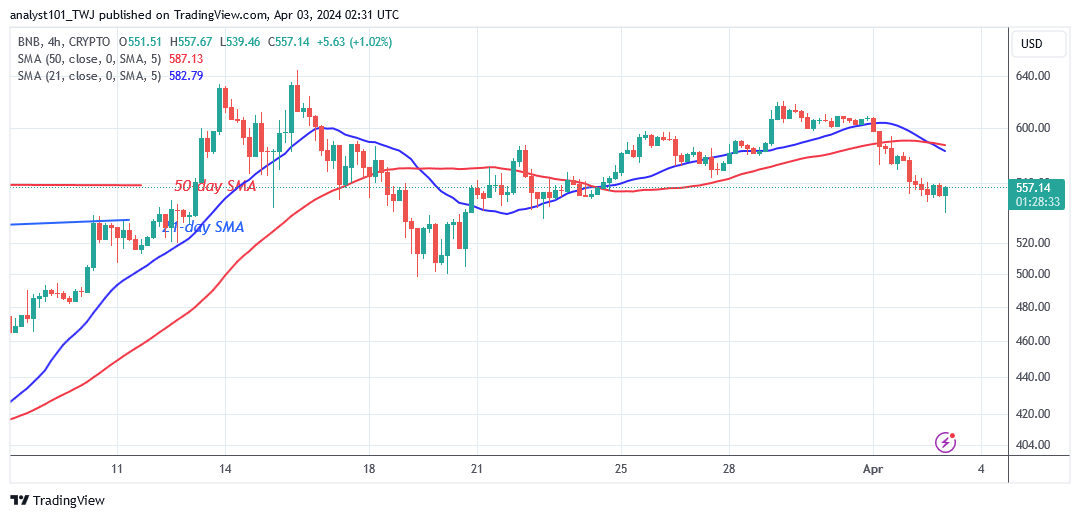
The BNB price is declining between the moving average lines. The cryptocurrency is restricted and can vary between the moving average lines. On the 4-hour chart, the price bars are below the moving average lines, indicating a current fall.
What Is the Next Direction for BNB (BNB)?
The cryptocurrency’s bullish ascent has come to an end as it recoups above $540. The cryptocurrency price fell to $539.50 before recovering. BNB is currently stabilizing above the $540 support. If the current support is breached, the decline will continue to the prior low of $498.In the meantime, the crypto signal is bearish.
You can purchase Lucky Block here. Buy LBLOCK
Note: Cryptosignals.org is not a financial advisor. Do your research before investing your funds in any financial asset or presented product or event. We are not responsible for your investing results