Lucky Block (LBLOCK/USD) Market Shows Bullish Momentum With Key Price Levels Tested
Estimated Reading Time: 3 minutes
Don’t invest unless you’re prepared to lose all the money you invest. This is a high-risk investment and you are unlikely to be protected if something goes wrong. Take 2 minutes to learn more

Lucky Block Price Forecast – September 9
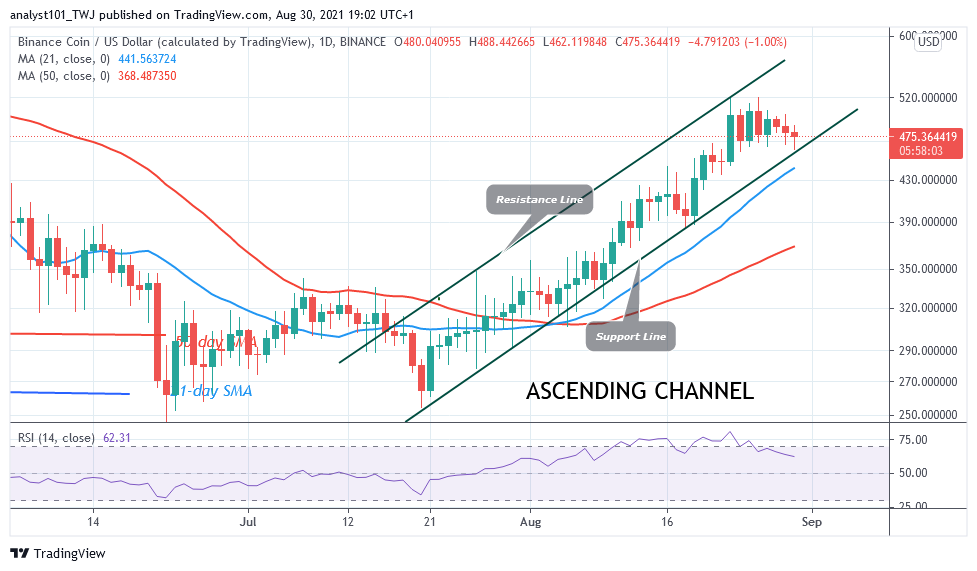
The LBLOCK/USD market shows bullish momentum with key price levels tested. The emerging bullish momentum was a result of the retraction at the $0.00001600 major support.
The indicators in the chart signal bullish momentum for LBLOCKUSD. The Moving Average (SMA 9) reflects an upward trend, especially with the price crossing above the moving average line, which typically indicates a potential reversal. The MACD (Moving Average Convergence Divergence) also shows signs of bullish divergence, with the histogram rising and the MACD line crossing over the signal line. This suggests increasing buying pressure, pushing the price higher. The green bars are becoming more dominant, further reinforcing the bullish outlook.
LBLOCK/USD Market Key Levels:
Resistance levels: $0.00002490, $0.00003290, $0.00003940
Support levels: $0.00001600, $0.00001160, $0.00000930
LBLOCK/USD – Daily Chart
The daily chart for LBLOCK/USD shows that a massive bullish move is set to begin as price bounced off the $0.00001600 major support.
Price action on the chart shows a break above the descending trendline, which was acting as a support for several months. The price has recently bounced off the $0.00001600 support level and is now hovering near $0.00001920.
The Change of Character (CHoCH) around the $0.00002100 area suggests a potential shift from bearish to bullish market sentiment. Additionally, the price has tested and held above the $0.00001600 support level, confirming it as a strong foundation for further upward movement.

What is expected of LBLOCK/USD in the coming days?
Given these bullish indicators and price action, a potential target for LBLOCKUSD in the coming days could be around $0.00003290, which serves as the next significant resistance level. If the market continues with its current upward momentum, we might even see a rally towards $0.00003940. The overall outlook remains bullish, and buyers may target these higher price points in the near future.

LBLOCK/USD – Four-Hour Chart
LBLOCKUSD shows signs of bullish momentum on the four-hour chart as it has bounced from the $0.00001600 support level. The price is currently trading above the 9-period SMA, indicating potential upward movement.
The diagonal resistance needs to be broken to confirm the bullish trend, with the next target set around $0.00002490. The MACD suggests increasing bullish strength as the histogram shifts towards positive territory.
Lucky Block (LBLOCK) Current Statistics
The current price: $0.00001920
Market Capitalization: $1,400,000
Trading Volume: $328
Do you need a coin that will 100X soon? Get LBLOCK here