Lucky Block Price Prediction: LBLOCK/USD To Go Up After Price Dips Below $0.002 Level
Estimated Reading Time: 3 minutes
Don’t invest unless you’re prepared to lose all the money you invest. This is a high-risk investment and you are unlikely to be protected if something goes wrong. Take 2 minutes to learn more

Free Crypto Signals Channel
After touching the daily high at $0.0019, the Lucky Block price prediction heads downward to give the buyers the opportunity to buy dip.
LBLOCK/USD Long-term Trend: Bullish (12 H Chart)
Key Levels:
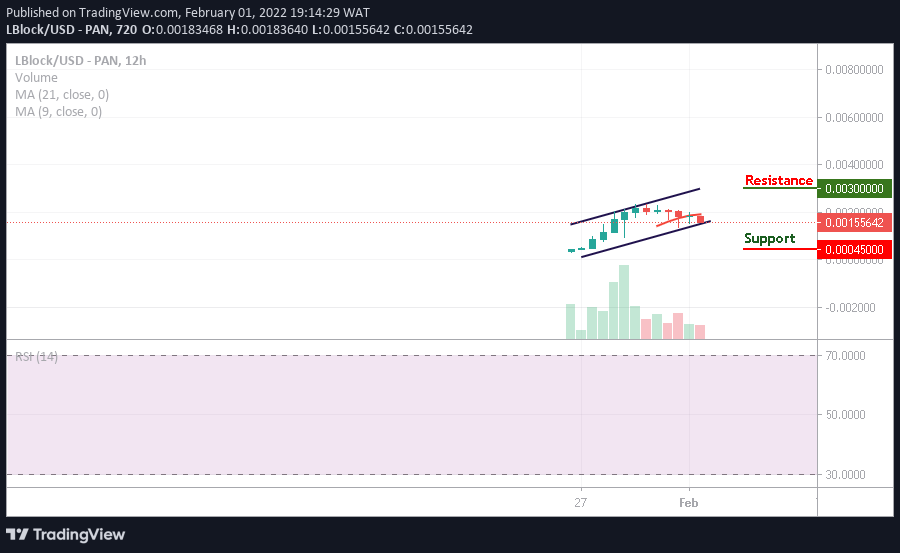
Resistance levels: $0.0030, $0.0035, $0.0040
Support levels: $0.00045, $0.00040, $0.00035
On the 12-hour chart, Lucky Block bulls have been rejected around $0.0018 level and as the coin slides to trade a $0.0015 at the time of writing this article. The price is floating within the channel formation, and it is currently below the 9-day moving average. The technical indicator Relative Strength Index (14) may give increase in bearish momentum if the signal line heads to the south. But the moment the coin crosses below the lower boundary of the channel, it is likely for the new buyers to enter the market.
Lucky Block Price Prediction: LBLOCK Price May Consolidate Before Moving Upward
Looking at the 12-hour chart, the Lucky Block price is currently changing hands at $0.00157 where it faces down. However, if the price of LBLOCK rises again and break above the 9-day moving average, the coin may begin its upward movement to retest the previous high around $0.0022 Level.
However, any further bullish movement above this level could hit the potential resistance levels at $0.0030, $0.0035, and $0.0040 while crossing below the lower boundary of the channel may hit the supports at $0.00045, $0.00040, and $0.00035 respectively.
LBLOCK/USD Medium-term Trend: Bullish (4 H Chart)
When compared on the 4-hour chart, LBLOCK price is seen under the 9-day and 21-day moving averages as the coin tries to resume back the upward movement. The next level of support may surface at $0.0014 and then locate further key support at $0.0010 and below if the bears step into the market.
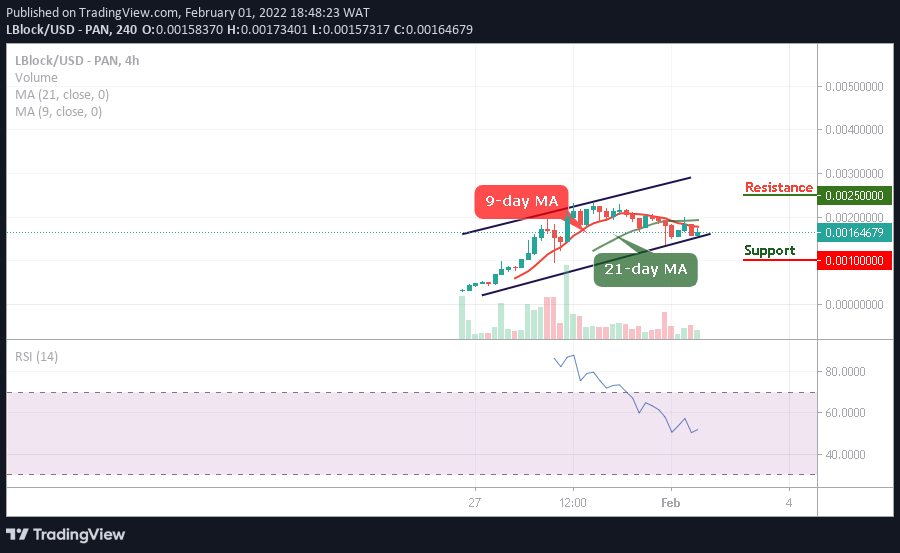
However, on the upside, if the bulls can gather enough momentum as it is to push the price back above the 9-day and 21-day moving averages; Lucky Block price could face the resistance level of $0.0025 and above as the Relative Strength Index (14) is ready to move above 55-level to confirm the bullish movement.
Read more: