BNB Stabilizes above Current Support as It Further Falls to $196
Estimated Reading Time: 2 minutes
Don’t invest unless you’re prepared to lose all the money you invest. This is a high-risk investment and you are unlikely to be protected if something goes wrong. Take 2 minutes to learn more

BNB (BNB) Long-Term Analysis: Bearish
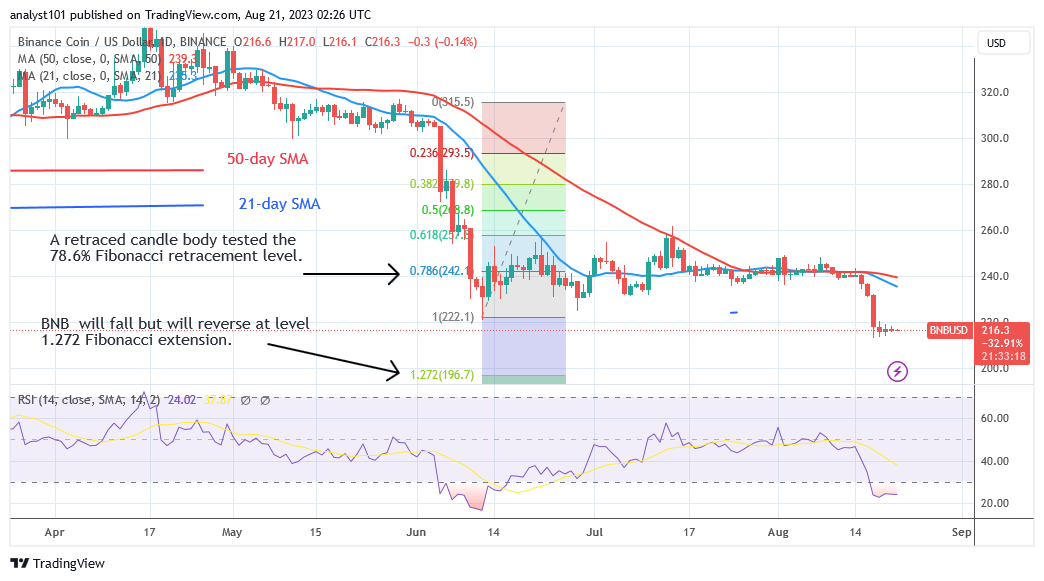
BNB’s (BNB) price falls below critical support as it further declines to $196. At the time of writing, the crypto asset is trading at $216.10. There is a chance that the cryptocurrency may continue to fall. BNB is currently trading in the market’s oversold zone. The altcoin is stabilizing above the $200 support level and may fall lower.
On June 12, after a price drop, BNB performed an upward correction, with a retraced candle body testing the 78.6% Fibonacci retracement line. The correction predicts that BNB will decline but will reverse at the Fibonacci extension of 1.272, or $196.70.
Technical indicators:
Major Resistance Levels – $440, $460, $480
Major Support Levels – $240, $220, $200
Binance Coin (BNB) Indicator Analysis
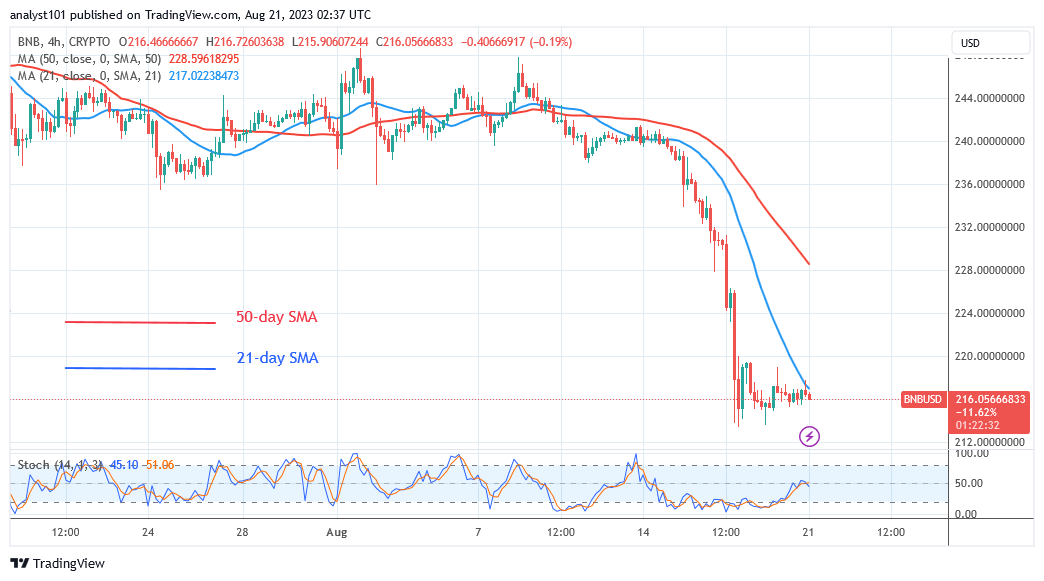
Currently, BNB has hit the oversold region of the Relative Strength Index at level 24 for period 14. As buyers emerge in the oversold region, the selling pressure is likely to ease. BNB is oversold, but any upward correction will be met with a rejection at $217. The altcoin may continue to fall to the bottom of the chart.
What Is the Next Direction for Binance Coin (BNB)?
Following the recent fall, BNB is currently trading between $212 and $220 as it further falls to $196. According to the price forecast, the altcoin will fall further to a low of $196.70. BNB is currently stabilizing above the current support level of $200.
You can purchase crypto coins here. Buy LBLOCK
Note: Cryptosignals.org is not a financial advisor. Do your research before investing your funds in any financial asset or presented product or event. We are not responsible for your investing results