Decentraland (MANA/USDT) Rebounds Toward $0.1400 as Momentum Turns Overbought
Estimated Reading Time: 2 minutes
Don’t invest unless you’re prepared to lose all the money you invest. This is a high-risk investment and you are unlikely to be protected if something goes wrong. Take 2 minutes to learn more

MANAUSDT Price Analysis – Decentraland attempts recovery but faces resistance overhead
MANA/USDT is currently trading around $0.1390 key area, showing a modest recovery after defending the $0.1160 support zone. The bounce has lifted price back into the mid-range, but momentum indicators are now entering overbought territory, suggesting that upside may be limited unless volume expands.
MANA/USDT Market Key Levels
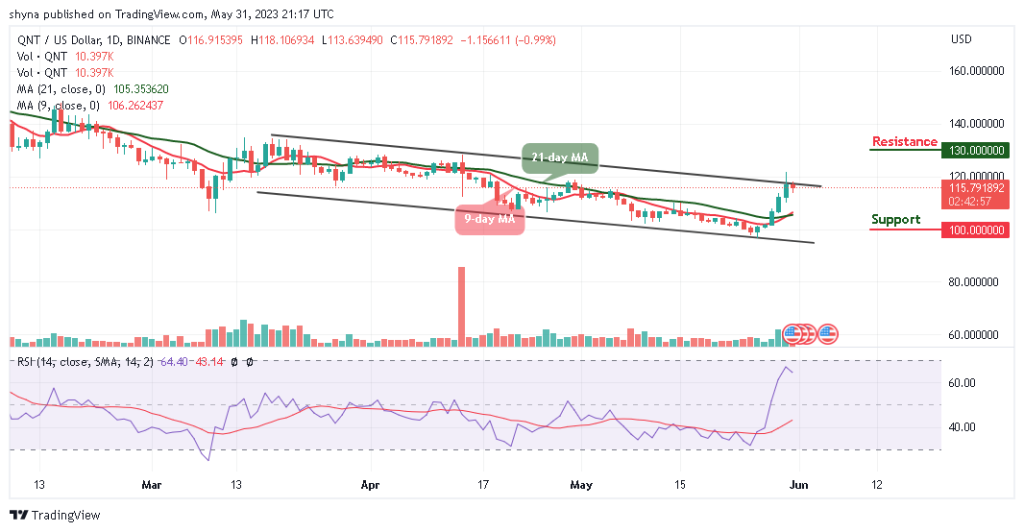
Resistance levels: $0.1570, $0.1940, $0.2460
Support levels: $0.1160, $0.1000, $0.0910

The market is testing a key reaction level, with volatility still subdued. This rebound does not yet qualify as a confirmed trend reversal. However, the Stochastic Oscillator signals overbought conditions, which often precede short-term pullbacks or consolidation.
Price is approaching the $0.14–$0.150 zone, a region that previously acted as a pivot and may attract sellers again. From a higher-timeframe perspective, MANA remains in a broader downtrend structure following its decline from the $0.39 zone.
The current price region around $0.139–$0.150 has served as a congestion zone in prior cycles. Right now the narrowing ADR reflects a market still lacking directional conviction. Traders are watching for either a breakout above $0.150 market zone or a rejection that reopens the path toward $0.1160 price level.

Market Expectation
On the lower timeframe, MANA is trading in a tight band with candles showing reduced range and volume. Price is hovering near its short-term average, and momentum is stretched. This type of behavior often leads to a pause or minor retracement before the next impulse. A breakdown below $0.1360 would expose $0.1169–$0.1000 as the next support zone.
You can purchase Lucky Block here. Buy LBLOCK
Note: Cryptosignals.org is not a financial advisor. Do your research before investing your funds in any financial asset or presented product or event. We are not responsible for your investing results.