Near Protocol (NEAR/USD) Market Bearish Potential Below Falling Trendline
Estimated Reading Time: 2 minutes
Don’t invest unless you’re prepared to lose all the money you invest. This is a high-risk investment and you are unlikely to be protected if something goes wrong. Take 2 minutes to learn more

Near Protocol Price Forecast – September 20
NEARUSD market bearish potential below the falling trendline. The falling trendline emerged after the inception of the downtrend in late May 2024.
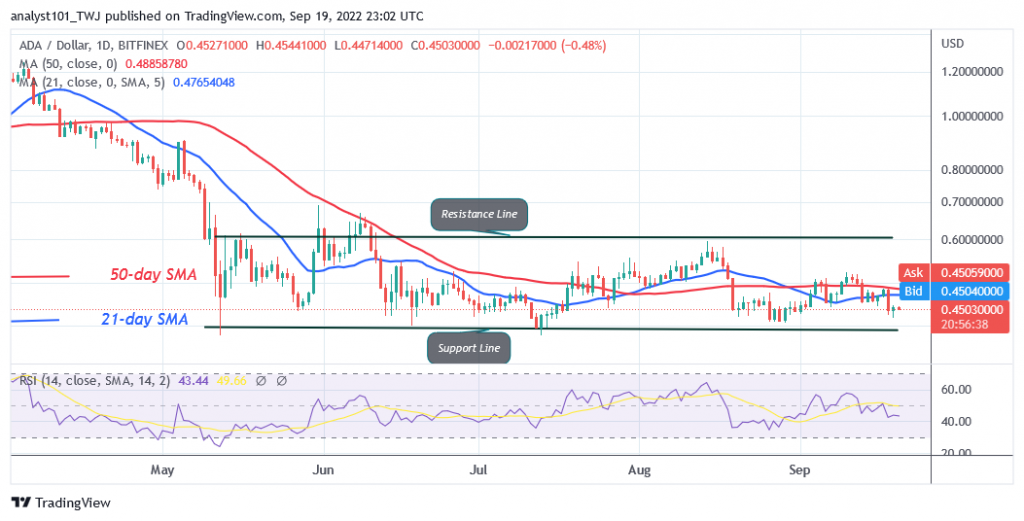
The technical indicators on the NEARUSD pair suggest a bearish outlook. The Relative Strength Index (RSI) stands around 46.88, signaling weak momentum and a potential move toward oversold conditions. The Simple Moving Average (SMA) at $4.0790 acts as dynamic resistance, further supporting the bearish case as the price struggles to hold above this level.
NEAR/USD Market Key Levels:
Resistance levels: $6.4930, $7.7080, $8.5220
Support levels: $3.0740, $2.4500, $1.5000
NEAR/USD – Daily Chart
The daily chart for NEARUSD shows a potential for a bearish continuation below the falling trendline.
Price action shows a possible rejection from the falling trendline. After a brief rally to this resistance level, the price may decline, breaking through the $3.0740 support. Sellers are dominating the overall trend as red candles form.

Where is the NEARUSD price likely to head?
Looking forward, NEARUSD could drop toward the next support levels. The immediate target is around $3.0740, which aligns with prior lows.
If bearish momentum continues, the price could extend to $2.4500. This bearish projection holds as long as the price remains below the falling trendline.

NEAR/BTC Price Analysis
NEARBTC is showing signs of a bearish reversal after testing the bearish order block at 0.00007900 BTC. The price is currently trading below the 9-day SMA at 0.00006920 BTC, signaling downward momentum.
The RSI at 43.15 indicates weak buying pressure and a possible continuation of the downward move. If the pair fails to reclaim the 0.00006890 BTC level, it could drop toward support at 0.00005870 BTC or lower.
Near Protocol (NEAR) Current Statistics
Current price: $3.9630
Market Capitalization: $5,000,000,000
Trading Volume: $415,040,000
Place winning NEAR/USD trades with us. Get NEAR here