OFFICIAL TRUMP (TRUMP/USD) Surges, Faces Possible Correction at $8
Estimated Reading Time: 3 minutes
Don’t invest unless you’re prepared to lose all the money you invest. This is a high-risk investment and you are unlikely to be protected if something goes wrong. Take 2 minutes to learn more
The OFFICIAL TRUMP (TRUMP/USD) market continues to exhibit vibrant and dynamic price action, characterized by strong volatility and frequent swings between demand and supply zones. Recently, however, bearish momentum had taken the upper hand, pushing the market downward until it found solid support around the $6.00 price level.
This support held firm against selling pressure, allowing bullish momentum to rebuild. Subsequently, buyers regained control and drove the price upward, breaking through key resistance levels and surging above the $8.00 mark. Despite this impressive recovery, the market now faces the possibility of a short-term correction as traders assess whether bullish strength can be sustained at higher levels.
OFFICIAL TRUMP (TRUMP/USD) Market Data
- TRUMP/USD Price Now: $8.17
- TRUMP/USD Market Cap: 1.6 billion
- TRUMP/USD Circulating Supply: $199.9 million TRUMP
- TRUMP/USD Total Supply: 999.9 million TRUMP
- TRUMP/USD CoinMarketCap Ranking: #51
Key Levels to Watch
- Resistance: $0.22, $0.25, $0.27
- Support: $0.16, $0.14, $0.12
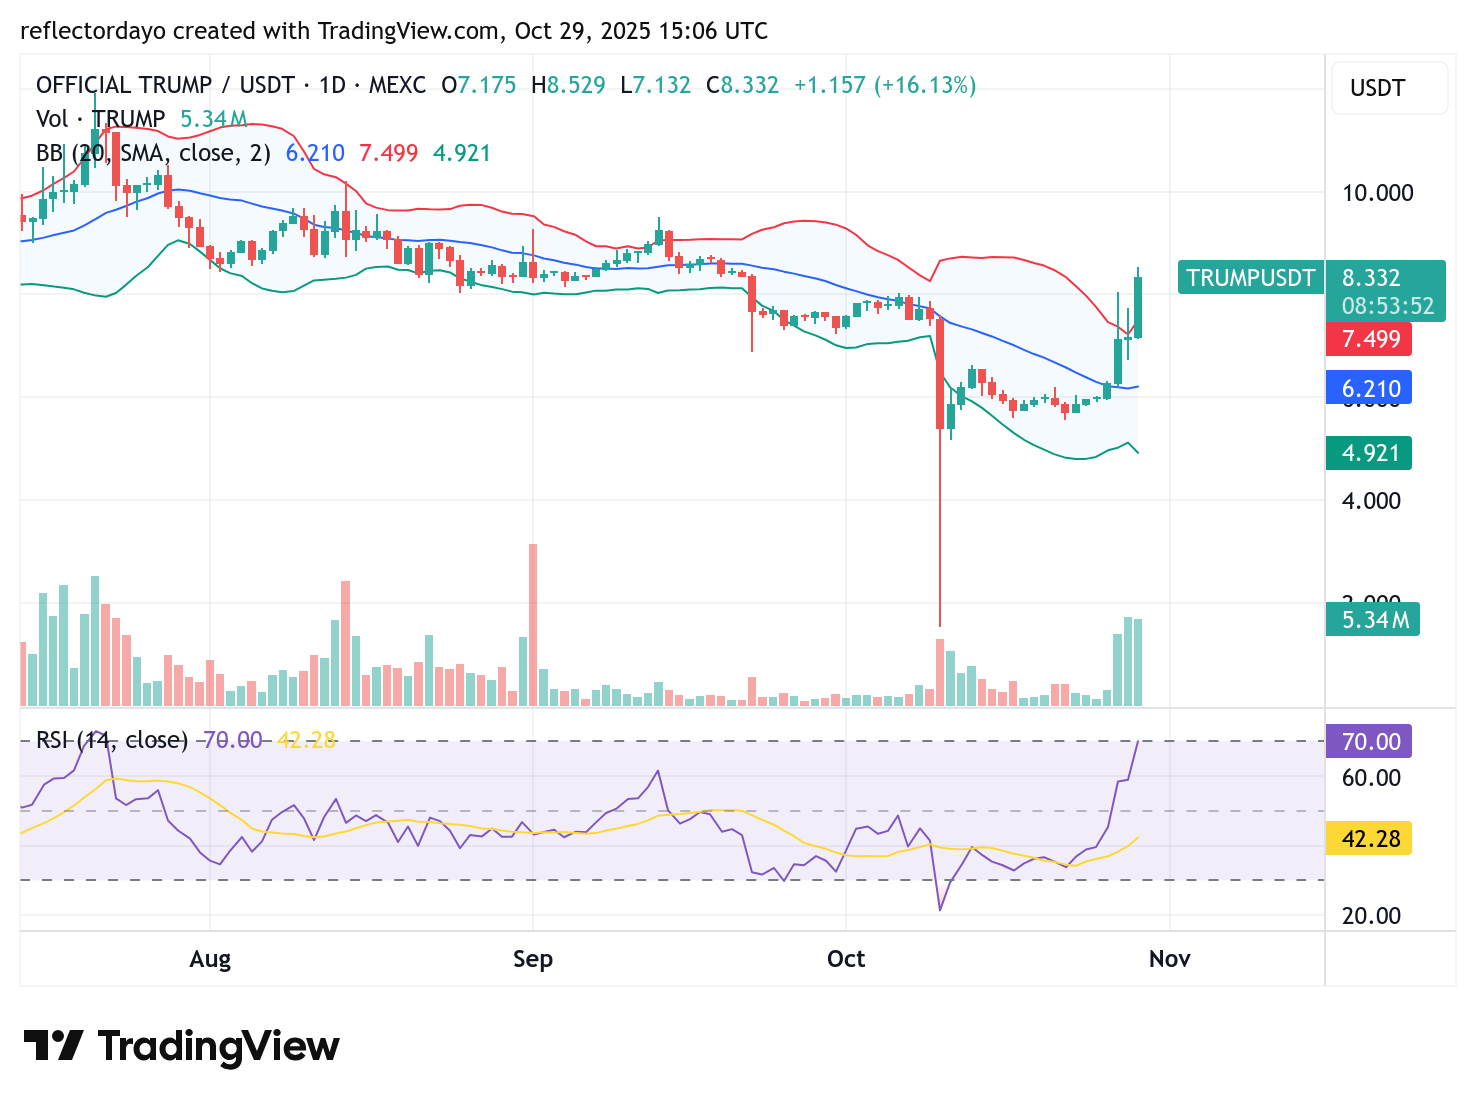
OFFICIAL TRUMP (TRUMP/USD) Daily Chart Outlook
Following the massive sell-off recorded on October 10, bearish momentum pushed the price downward, testing near the $1.00 threshold. Some traders seized the opportunity to buy at this low, stabilizing the OFFICIAL TRUMP market around the $6.00 price level. Recently, however, a possible catalyst appears to have triggered a sudden bullish outburst. The price has surged from the $6.00 area, breaking decisively above the $8.00 level, supported by strong trading volume.
Currently, traders are eyeing the $8.00 zone as a potential new support area. Nevertheless, caution is advised amid the excitement, as the Bollinger Bands show a wide bandwidth—indicating heightened volatility—while the RSI line is leaning into the overbought region, suggesting a possible short-term correction.
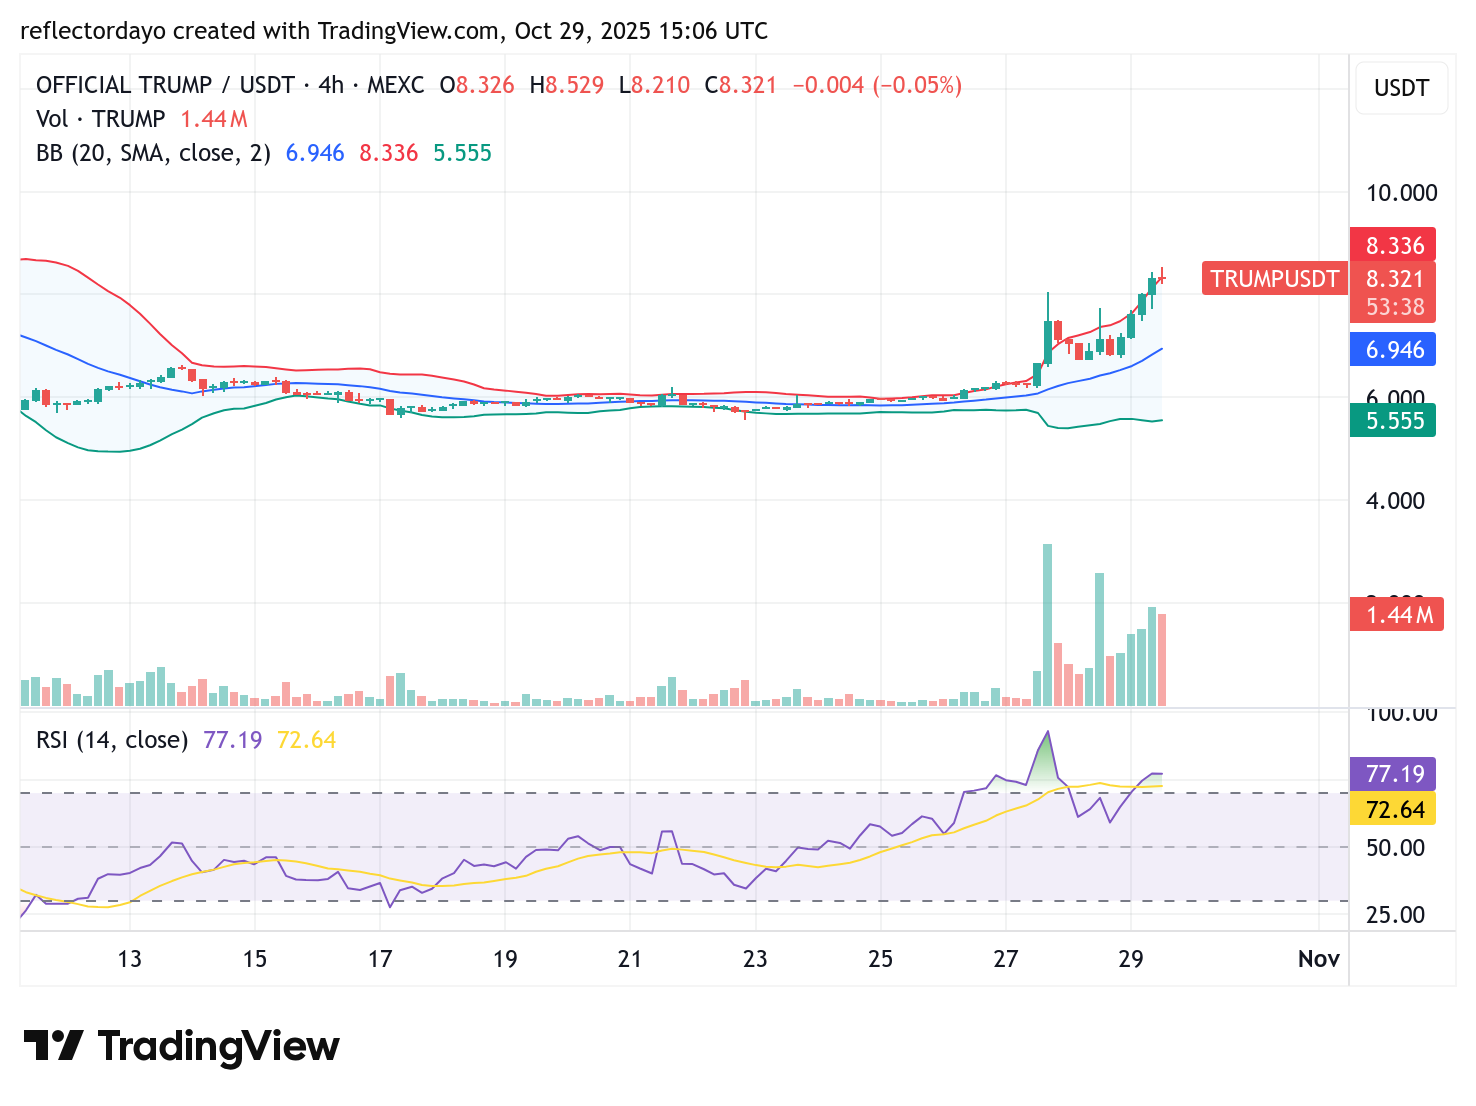
TRUMP/USD 4-Hour Chart Outlook
The 4-hour chart provides a deeper insight into recent market activities. Indicators suggest strong trading momentum has been underway, reflecting heightened participation from both buyers and sellers. However, the latest trading session could signal a potential correction on the horizon.
A gravestone doji has appeared, accompanied by a substantial trading volume on the histogram. This pattern indicates active engagement from both bulls and bears but also highlights a state of indecision in the market. Traders should closely monitor subsequent trading sessions and pay particular attention to the $8.00 price level in case a correction unfolds.