OFFICIAL TRUMP (TRUMP/USDT) Indicates Potential Reversal Amid Price Downturn
Estimated Reading Time: 3 minutes
Don’t invest unless you’re prepared to lose all the money you invest. This is a high-risk investment and you are unlikely to be protected if something goes wrong. Take 2 minutes to learn more

The price for OFFICIAL TRUMP against Tether has shown a notable pause in price movement over the past few weeks. The coin has been oscillating around a critical support limit despite optimism that surrounds the market about its upside in the near term. As it stands, the pair has continued to move within a narrow space, as seen by the cluster of the Guppy Multiple Moving Averages (GMMA) with a cautious outlook.
At the moment, the price movement on the chart suggests an accumulation phase may be ongoing. This suggests that a breakout above resistance could signal a reversal toward the next resistance levels.
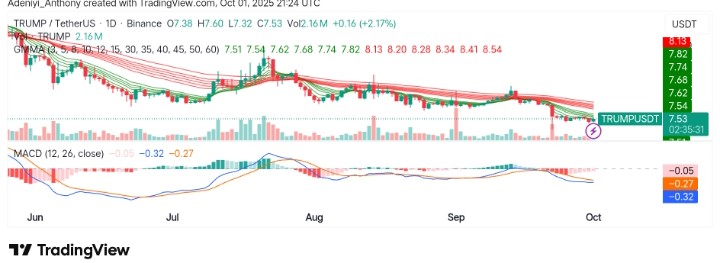
Currently, Official Trump trades at $7.53, recording more than 2.16 million traded volumes for the day.
Technical Indicators
Major Resistance Levels: $7.80, $8.15, and $8.55
Major Support Levels: $7.32, $7.05, and $6.80
Official Trump Technical Analysis
On the daily timeframe, Official Trump against Tether is currently hovering below the $8.15 resistance, suggesting that there might be a need to break out imminently as the price appears to be building a base around the current limit. As it stands, if the pair can manage to break above $7.80 in the coming session, a new era of bullish trend may be seen; otherwise, the current trend will continue towards $6.80.
Looks like bottomed out.
With the “Democrat Shutdown,” it’s a coin to watch. pic.twitter.com/z3iQqxuNwb
— Dex 🕸️ (@dexpips) October 1, 2025
.
Meanwhile, @dexpips opines that Trump seems to be bottoming out amid the Democratic shutdown. The analyst believes the coin could see bullish action soon if the price can sustain above the current level.
TRUMP/USDT Analysis: Facing Key Resistance: What’s Next?
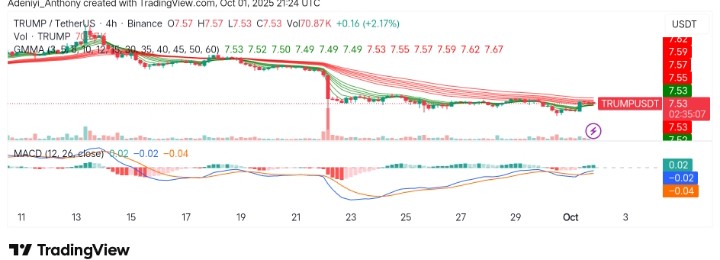
From what looks like a directionless movement, TRUMP/USDT has continued to consolidate near key support levels, holding steady around $7.52 despite a slight increase in the recent price around the $7.60-$7.62 range. The MACD seems to be showing mixed signals, with a slight bullish crossover. However, the momentum remains weak. As the GMMA indicates a narrowing price range. Right now, the price is struggling to break through the resistance, with further downward pressure possible if $7.50 fails to hold.
You can purchase crypto coins here. Buy Crypto