Ondo Finance (ONDO/USD) Seeks Support at $1.12 Level
Estimated Reading Time: 2 minutes
Don’t invest unless you’re prepared to lose all the money you invest. This is a high-risk investment and you are unlikely to be protected if something goes wrong. Take 2 minutes to learn more
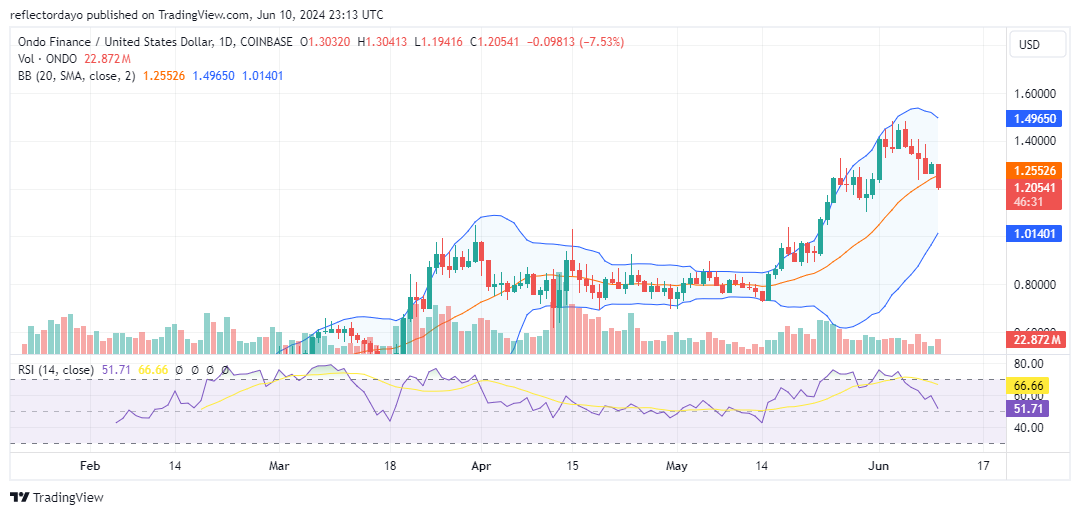
The Ondo Finance market experienced a prolonged struggle around the $0.80 price level. By mid-May, the bulls gained the upper hand, breaking out of the consolidation trend. The price continued to rise, peaking at $1.48 in early June, which triggered bearish sentiment. However, according to the crypto signal observed in the chart, residual bullish sentiment is slowing the downward movement.
The Ondo Finance Market Data
- ONDO/USD Price Now: $1.21
- ONDO/USD Market Cap: $1.7 billion
- ONDO/USD Circulating Supply: 1.4 billion
- ONDO/USD Total Supply: 10 billion
- ONDO/USD CoinMarketCap Ranking: #59
Key Levels
- Resistance: $1.30, $1.40, and $1.45
- Support: $1.16, $1.10, and $1.00.
The Ondo Finance Market Through the Lens of Indicators
As the Ondo Finance price approaches the key $1.20 level, minor signs of bullish activity are emerging in the bearish candlesticks. This suggests that investors are eyeing this level for potential entry points. Additionally, the $1.20 level holds historical significance as the last support level that facilitated the market’s surge past $1.40 and its subsequent peak.
However, despite these bullish indications, they are not strong enough to confidently predict a rally from this point. The current bearish candlestick suggests that bulls may struggle to maintain this support level. If the $1.20 support fails, the next potential level for bullish intervention could be around $1.10.

ONDO/USD Price Prediction: 4-Hour Chart Analysis
The 4-hour Bollinger Bands chart indicates that the bears might continue to drive the market downward, as bearish momentum is gaining strength. The Relative Strength Index (RSI) is now at 32, which, although near the oversold region, underscores the current vigor of the bears.
Investors should monitor this critical support level closely, as breaking it could trigger more bearish sentiment and further price declines. If this occurs, traders should watch for a potential bounce around the $1.10 price level.