POL (Prev. MATIC) Price Prediction: POL/USDT Breaks Out to the Downside
Estimated Reading Time: 2 minutes
Don’t invest unless you’re prepared to lose all the money you invest. This is a high-risk investment and you are unlikely to be protected if something goes wrong. Take 2 minutes to learn more

Date: February 7, 2026
The POL (Prev. MATIC) market had been perceived as edging closer to a breakout while trading within a symmetrical triangle pattern. However, this setup proved risky, as the market eventually resolved in a bearish breakout. More details are provided below.
POL/USDT Long-Term Trend — Bearish (Daily Chart)
Key Price Levels
Resistance: $0.0950, $0.1150, $0.1300
Support: $0.0900, $0.0850, $0.0800
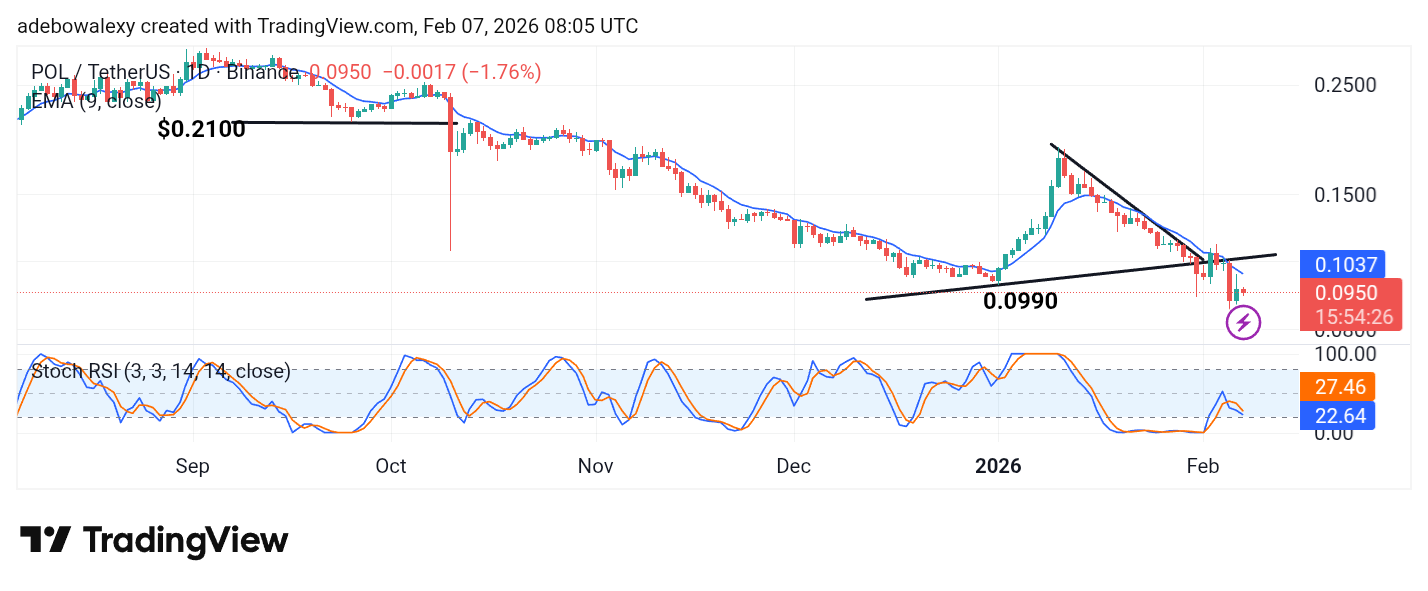
As previously anticipated, the POL (Prev. MATIC) market has broken out. However, the breakout occurred to the downside. As a result, the current session is trading below the lower boundary of the symmetrical triangle pattern. Consequently, price action remains below the 9-day Exponential Moving Average (EMA). In addition, the Stochastic RSI (SRSI) lines continue to trend downward into the oversold region.
POL/USDT Price Prediction: POL (Prev. MATIC) Bears Stay in Control (Daily Chart)
On the daily chart for POL (Prev. MATIC), price action continues to trend lower. The most recent daily candle remains bearish and is positioned below the opening price of the previous session, reinforcing the broader bearish outlook.
Meanwhile, the SRSI indicator lines remain directed toward the oversold region, suggesting that bearish momentum is still dominant.
POL/USDT Price Prediction: POL (Prev. MATIC) Bulls Appear Constrained (4-Hour Chart)
On the 4-hour chart, POL (Prev. MATIC) shows attempts to recover from bearish sentiment, but these efforts appear to have been rejected. The latest candle in the ongoing session is a small bullish one, reflecting only limited upside movement.
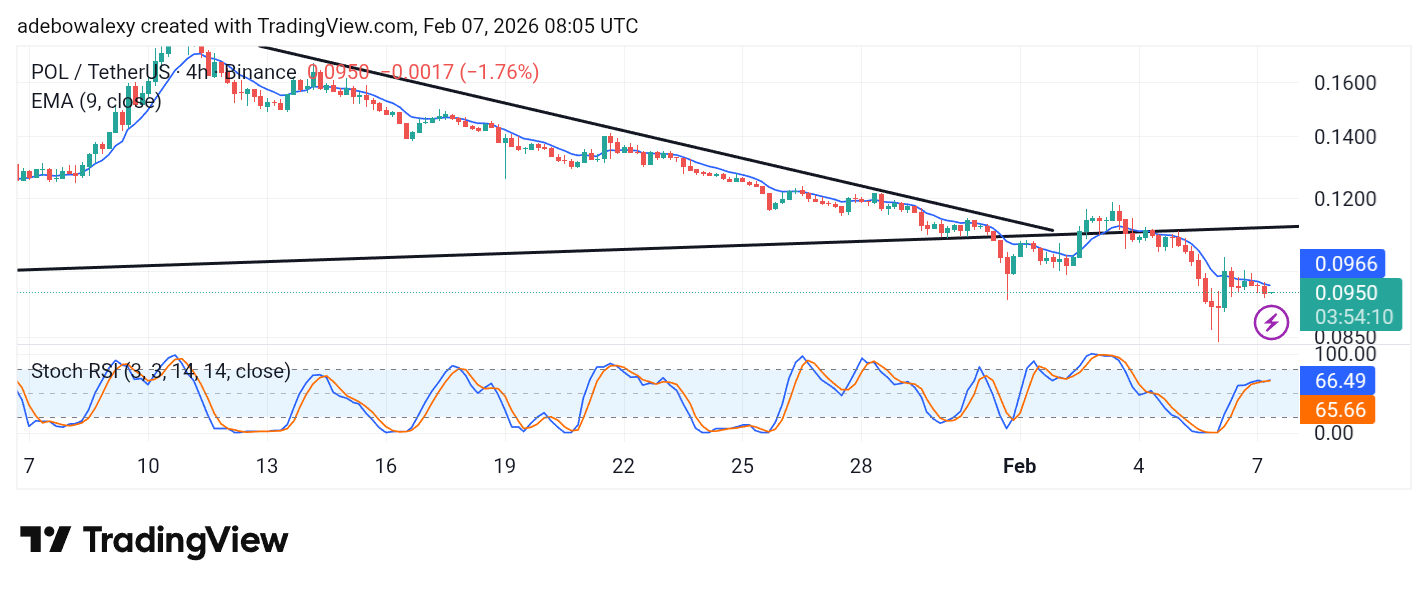
Price action continues to trade below the 9-day EMA curve, while the SRSI lines are edging slightly higher. However, resistance remains strong, and price may move toward the $0.0925 and $0.0900 support levels.