Polkadot (DOT/USDT) Sees a Trend Reversal from an Oversold Level
Estimated Reading Time: 3 minutes
Don’t invest unless you’re prepared to lose all the money you invest. This is a high-risk investment and you are unlikely to be protected if something goes wrong. Take 2 minutes to learn more
Polkadot Long-term Analysis: Bullish
Polkadot against the Tether has shown signs of strength following a prolonged consolidation above the $4.000 level. However, after weeks of sideways actions, the pair is attempting to break out from a technical base around $4.750, eyeing a close above the $5.000 level.
Recently, the pair action suggests early accumulation with the price rebounding from the lower Bollinger Band while the Stochastic lines trend to the north. However, the pair has seen a gain of over 2% with supporting volume, hinting at a new mid-term bullish move.
Currently, Polkadot trades at $4.903, recording over 18 million traded volumes for the week.
Technical Indicators
Major Resistance Levels: $5.500, $6.410, and $9.000
Major Support Levels: $4.750, $3.080, and $2.600
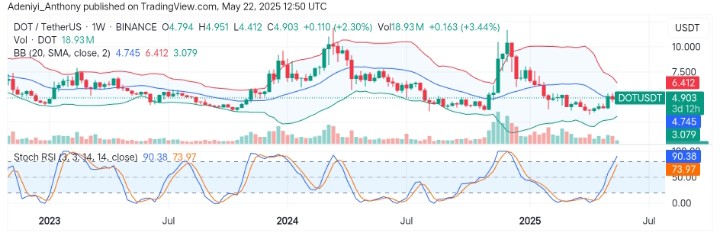
Polkadot Technical Analysis
On the week chart, Polkadot against the Tether is emerging from a prolonged range-bound zone with a potential shift towards $5.000. However, the price recently bounced from the lower segment of the squeezed Bollinger Bands, suggesting the bulls are in support of the move.
From another angle, the stochastic oscillator signals an overbought condition as the line extends into the 90-mark level, suggesting more improvement can be seen in the short term.
To this end, due to the squeezing Bollinger Bands, a cool-off may be experienced with an impending bullish breakout towards $6.410 in the near term.
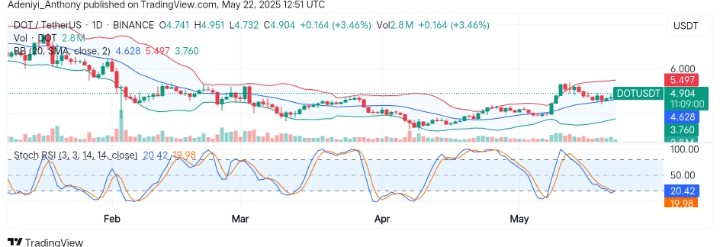
DOT/USDT Analysis: What’s Next?
On the daily timeframe, DOT/USDT appears to be holding above the 20 simple moving averages dynamic line of the Bollinger Bands, showing a slight squeeze as the possibility of an expansion looms.
However, the Stochastic RSI presents a bullish crossover from an oversold zone, projecting an early buying signal as the volume remains stable.
To this end, with an increase in bullish participation the price above $4.910, a break above $5.495 may be possible, even towards $6.000. However, a dip below $4.628 will invalidate this approach.
You can purchase crypto coins here. Buy LBlock