Shiba Inu (SHIB/USD) Anticipates a Bearish Breakout
Estimated Reading Time: 2 minutes
Don’t invest unless you’re prepared to lose all the money you invest. This is a high-risk investment and you are unlikely to be protected if something goes wrong. Take 2 minutes to learn more

Price Analysis: Market Experiences a Bearish Reversal as it Resumes its Initial Trend
In the current landscape of the SHIB/USD market, a persistent bearish trend has been observed. After finding initial support at the $0.00001280 mark, the price underwent a bullish correction. However, this rebound was short-lived as the formation of a head and shoulders pattern emerged, traditionally interpreted as a precursor to a bearish reversal.
SHIB/USD Key Levels
Demand Levels: $0.00001280, $0.00001010
Supply Levels: $0.00001840, $0.00002230

A closer examination of the daily Moving Average (MA) reveals a bearish signal aligning with the broader trend, as the price continues to trade beneath this critical technical indicator. This is often seen as a confirmation of the ongoing downward momentum.
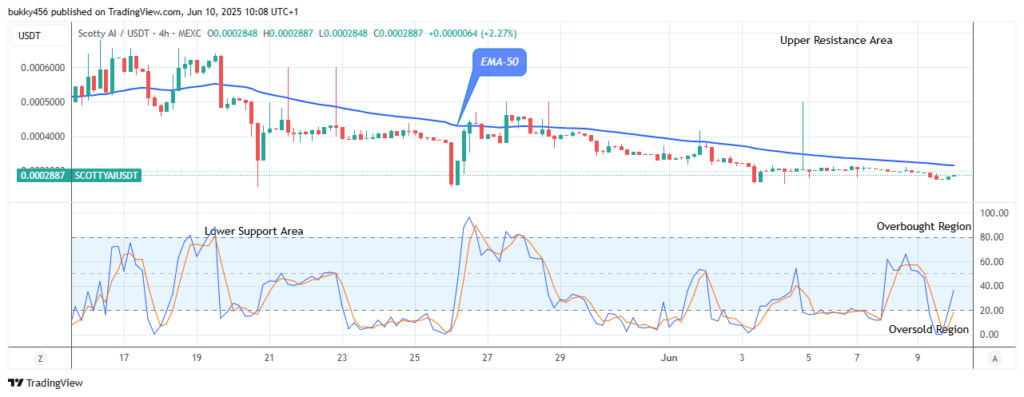
Transitioning to a 4-hour timeframe, recent price behavior suggests a phase of consolidation. This phase is characterized by a narrowing of price movements and is typically followed by a significant expansion in price action. Given the prevailing trend, expectations are leaning towards a bearish continuation.
Contrastingly, the 4-hour Relative Strength Index (RSI) presents a somewhat conflicting signal. Despite the bearish trend, the RSI indicates a building momentum in price, which could be seen as a divergence as it can be interpreted as continuation of the consolidation period.

Market Expectation
As SHIB/USD price still consolidate , it’s imperative to consider the potential of a bearish breakout, which could be substantiated by the RSI falling into the overbought territory . The key to recognizing the definitive breakout will likely be the shift of the 4-hour RSI into the oversold region, which historically increases the likelihood of a downward price expansion.
You can purchase Lucky Block here. Buy LBLOCK
Note: Cryptosignals.org is not a financial advisor. Do your research before investing your funds in any financial asset or presented product or event. We are not responsible for your investing results.