Shiba Inu (SHIBUSD) Experiences Correction Featuring a Bullish Flag Pattern
Estimated Reading Time: 2 minutes
Don’t invest unless you’re prepared to lose all the money you invest. This is a high-risk investment and you are unlikely to be protected if something goes wrong. Take 2 minutes to learn more

Market Analysis – Prices Show Bullish Flag Pattern
Shiba Inu (SHIBUSD) experienced a substantial price surge during the initial phase of March. The explosion of the price was propelled by a series of three consecutive white soldiers originating from the demand zone around $0.00000860. This bullish momentum propelled the price upwards by over three hundred and fifty percent within a single bullish displacement. However, the rapid ascent was met with signs of exhaustion shortly thereafter.
SHIBUSD Key Levels
Demand Levels: $0.0000210, $0.0000150, $0.0000090
Supply Levels: $0.0000370, $0.0000290, $0.0000870
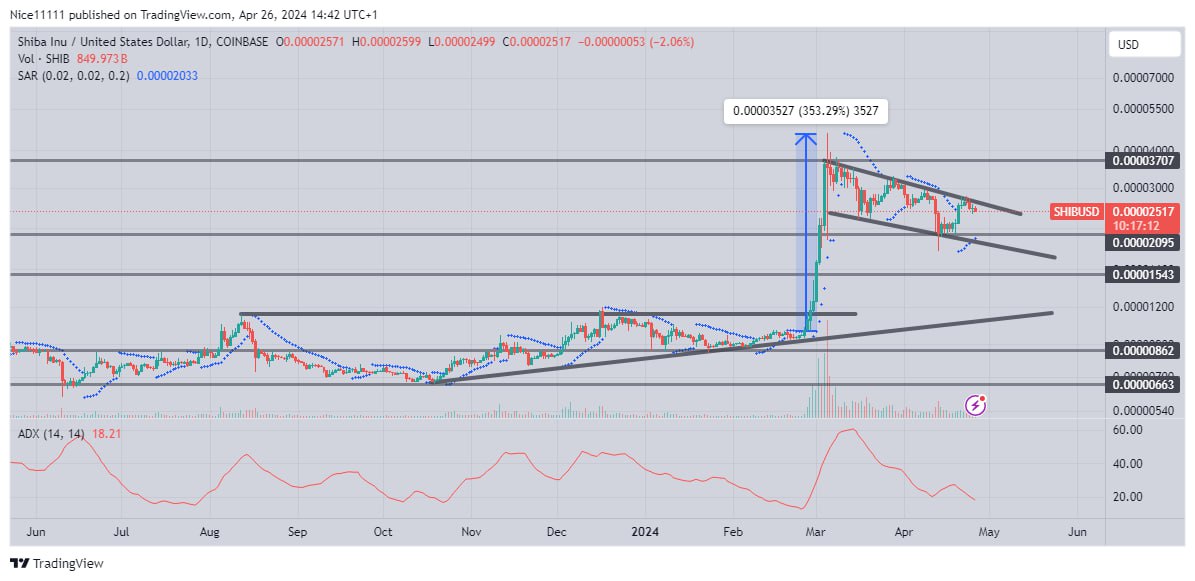 The intensity of Shiba Inu’s price surge was reflected in technical indicators, notably the Average Directional Index (ADX), which surged from 14 to 58 in less than two weeks. Concurrently, volume bars on the daily chart exhibited a notable increase.
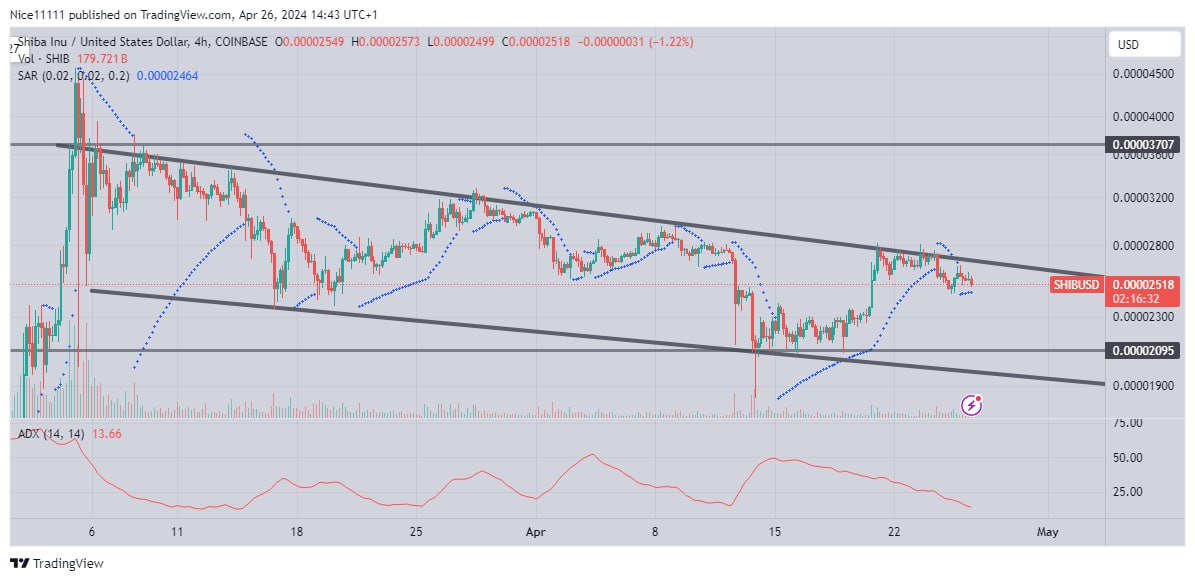
Following the rally, the price encountered resistance around the $0.0000370 level, leading to a decline in bullish momentum. This slowdown in price action resulted in the formation of a bullish flag pattern on the daily timeframe.
Market Expectation
Market sentiment suggests that the recent price decline has established a pattern of consistent lower swing highs and lows. The ADX has correspondingly decreased to 18.00, indicating a potential phase of reaccumulation as the market conserves energy for future bullish movements. A notable target for this phase appears to be the swing high observed in January at $0.0000370, where liquidity is anticipated to be substantial.
You can purchase Lucky Block here. Buy LBLOCK
Note: Cryptosignals.org is not a financial advisor. Do your research before investing your funds in any financial asset or presented product or event. We are not responsible for your investing results.