Solana (SOL) Price Prediction: SOL/USDT Stays Below the $150 Mark
Estimated Reading Time: 3 minutes
Don’t invest unless you’re prepared to lose all the money you invest. This is a high-risk investment and you are unlikely to be protected if something goes wrong. Take 2 minutes to learn more

Date: January 16, 2026
The Solana market received a boost over the previous weeks as its price action made a U-turn from the $120 price level. Since then, the market has remained on an upward trajectory. However, it now appears to be facing resistance at the $150 threshold.
Long-Term Trend — Bullish (Daily Chart)
Key Price Levels
Resistance: $145, $150, $155
Support: $140, $135, $130
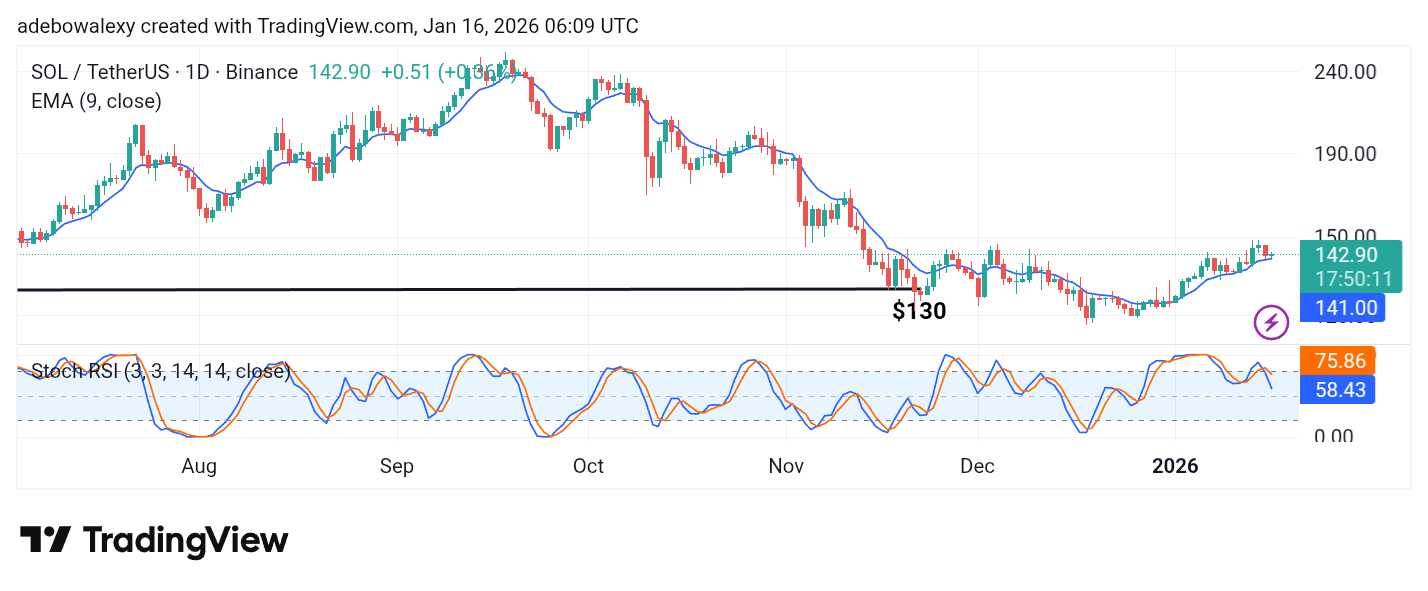
The ongoing session in the Solana 24-hour market is bullish. This is represented by a small green price candle, which sits just above the 9-day Exponential Moving Average (EMA). The Stochastic Relative Strength Index (SRSI) lines can be seen dipping sharply into the oversold region following a bearish crossover just above the 80 level of the indicator.
Solana (SOL) Price Prediction: Will Solana Stay Above the EMA?
Going by the current outlook of the Solana market, the $150 price level presents strong resistance to recent price movement. The latest price candle suggests that headwinds remain strong at this threshold. As a result, price action has taken on a compressed appearance. Nevertheless, price action remains above the 9-day EMA curve, with the most recent candle staying green.
The SRSI indicator lines have crossed and are now trending downward. However, the speed of this downward movement appears excessive compared to the relatively mild decline in price action. This points to weakness in bearish momentum, suggesting that price action may continue to hold above the 9-day EMA curve.
Solana (SOL) Price Prediction: SOL/USDT Eyes a Continued Upward Retracement (4-Hour Chart)
On the 4-hour timeframe, the Solana market is trading below the 9-day EMA curve. The last three price candles on the chart are positioned beneath the EMA, unlike the daily chart. However, the market still shows signs of short-term progress.
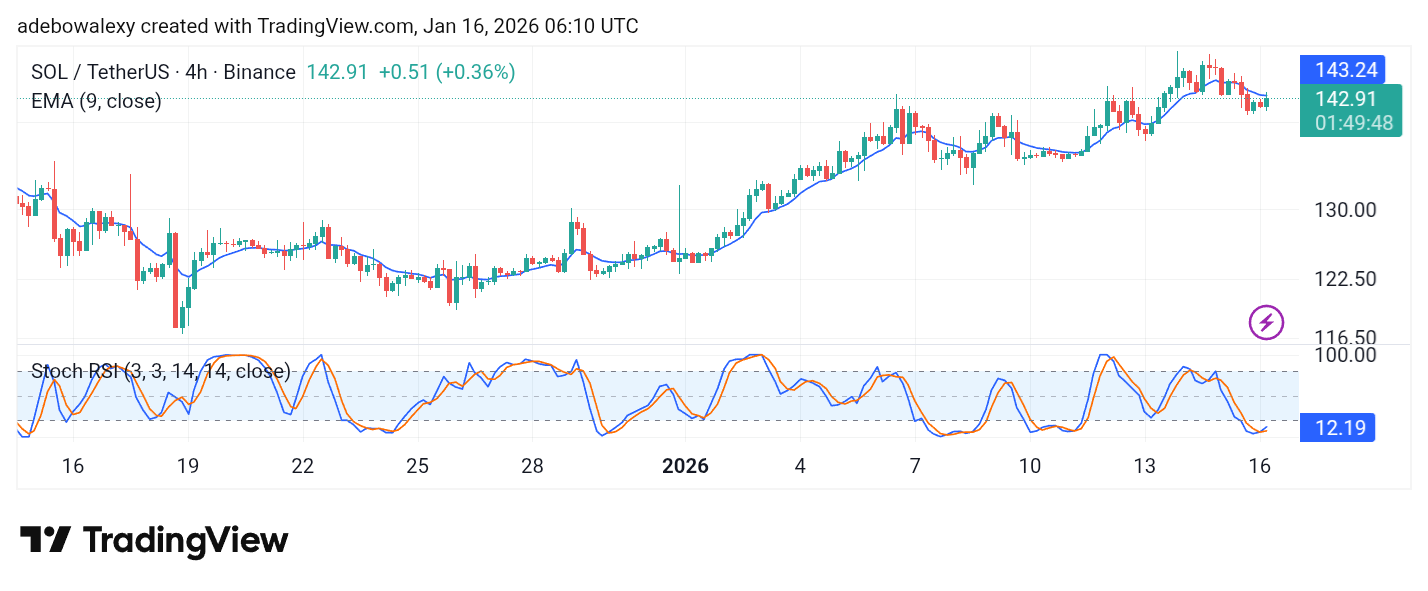
This impression is drawn from the fact that the most recent price candle has pushed upward toward the 9-day EMA curve. Similarly, the SRSI indicator lines have performed a bullish crossover in the oversold region, and the resulting lines are now rising slightly. This supports the view that price action is improving in the short term. As such, the market may still attempt a move toward the $145 and $147 price levels.