Don’t invest unless you’re prepared to lose all the money you invest. This is a high-risk investment and you are unlikely to be protected if something goes wrong. Take 2 minutes to learn more
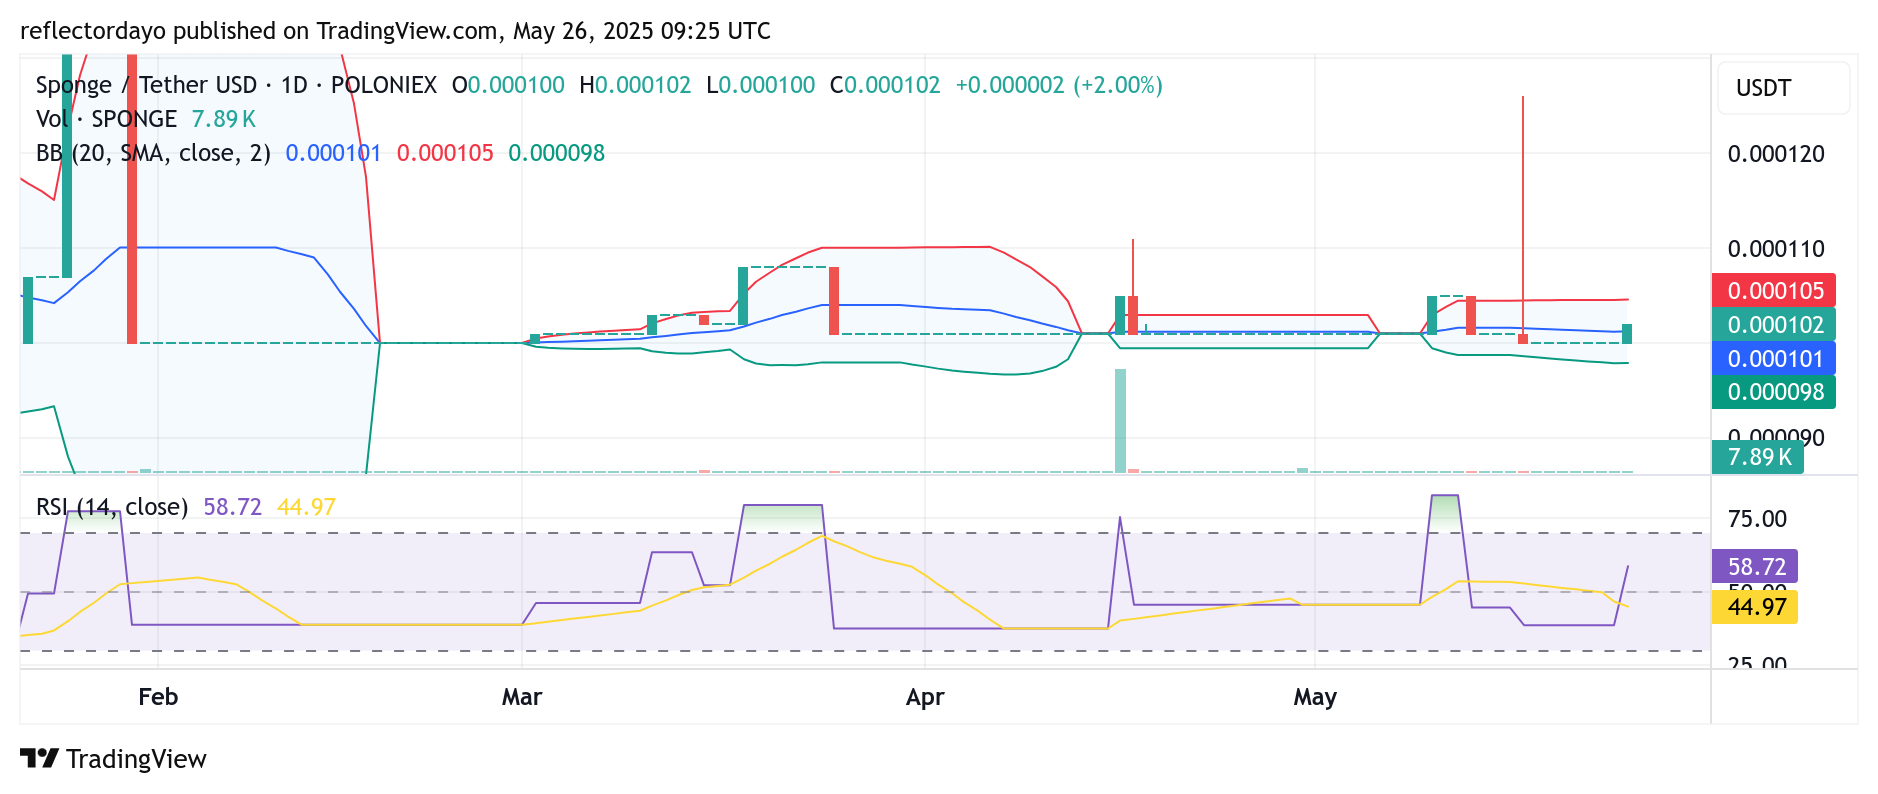
The $SPONGE market has decisively moved past the crucial $0.0001 mark, signaling a potential end to its recent consolidation phase. This isn’t just a ripple; the bullish momentum feels robust as the price has successfully navigated initial resistance at $0.000101. The market’s next test is the $0.000105 level. A strong push beyond this point could unleash further buying pressure, potentially paving the way for a sustained upward trend.
Key Technical Levels to Monitor:
Resistance: $0.000110, $0.000120, $0.000130
Support: $0.000090, $0.000085, $0.000080
Daily Chart: Is $SPONGE’s Rally Just Beginning?
On the daily chart, $SPONGE‘s bullish price action is certainly emerging, though the trading volume remains somewhat subdued. This suggests that while a limited number of active traders are currently driving the upward move, there’s significant room for more participants to join the rally. This influx of interest could inject the momentum needed to propel prices even higher. Despite the break above $0.000101, the Bollinger Bands haven’t fully expanded yet, hinting that this uptrend might still be in its nascent stages with considerable upside potential if buying pressure intensifies.
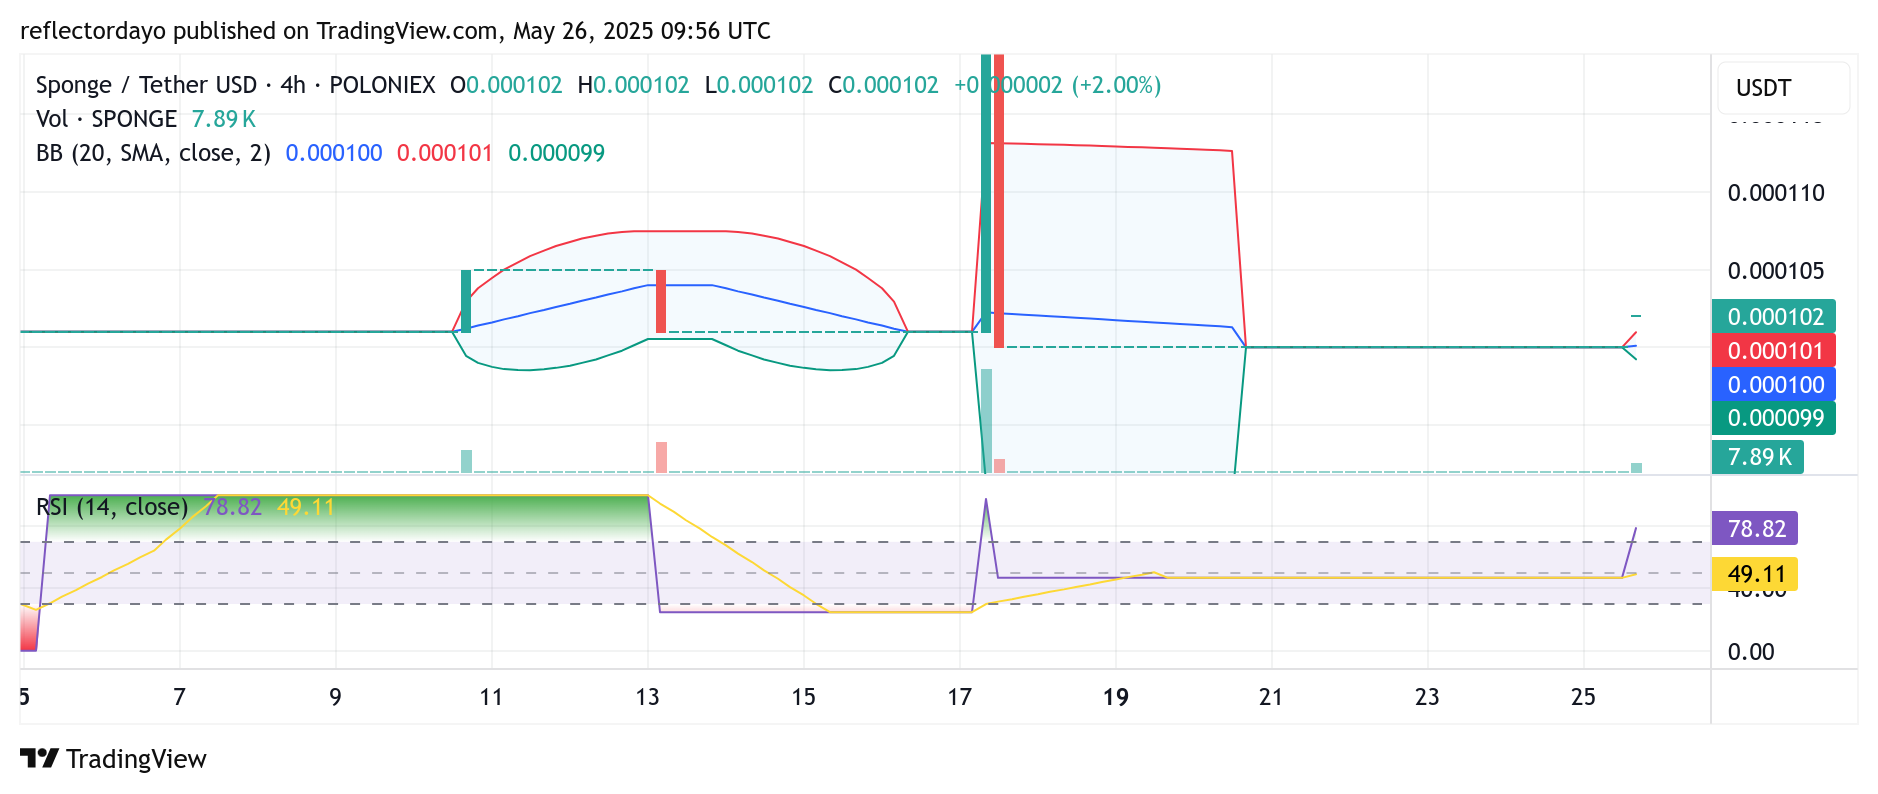
4-Hour Chart: Volume Signals Growing Confidence in $SPONGE
A closer look at the 4-hour chart offers an encouraging sign: trading volume is on the rise. This uptick provides crucial validation for the nascent bullish trend and indicates increasing market interest in SPONGE. With this bullish momentum still gathering steam, SPONGE/USD is poised to attract fresh capital from investors anticipating continued gains. Entering the market now could position traders to maximize potential profits as the price action strengthens.
Lucky Block Price Prediction – January 31 The Lucky Block price prediction trades around $0.000153 as the buying pressure could push the market to the upside. LBLOCK/USD Long-term Trend: Ranging (1D Chart) Key Levels: Resistance levels: $0.000240, $0.000250, $0.000260 Support levels: $0.000095, $0....
Bitcoin Price Prediction – June 21The Bitcoin market explodes, breaking through the range resistances of the US currency after finding support around the line of $25,000 of the lower main range support at $26,000. In the last several hours of today’s session, bears have been overwhelmed by the pres...
Bitcoin Price Prediction – July 11 BTC/USD market sets for a reversal to the upside as it consolidates above the $56500 major support. Invalidation of the $63800 high will likely change the market’s sentiment, causing a breakout across the major trendline. The Relative Strength Index (RSI) is...
We send 3 VIP signals a week in our free Telegram group, each signal comes with a full technical analysis on why we are taking the trade and how to place it through your broker.
Get a taste of what the VIP group is like by joining now for FREE!