$SPONGE (SPONGE/USD): A Bullish Outlook Amidst Volatility
Estimated Reading Time: 2 minutes
Don’t invest unless you’re prepared to lose all the money you invest. This is a high-risk investment and you are unlikely to be protected if something goes wrong. Take 2 minutes to learn more

The SPONGE/USD market has been a rollercoaster ride, marked by significant volatility and periods of consolidation. Despite these challenges, the bullish sentiment remains strong, with the crypto signal recently breaking above the crucial $0.000055 resistance level.
Key Market Dynamics:
- Resistance Levels: $0.00005, $0.000055, $0.000060
- Support Levels: $0.000020, $0.0000195, $0.000019
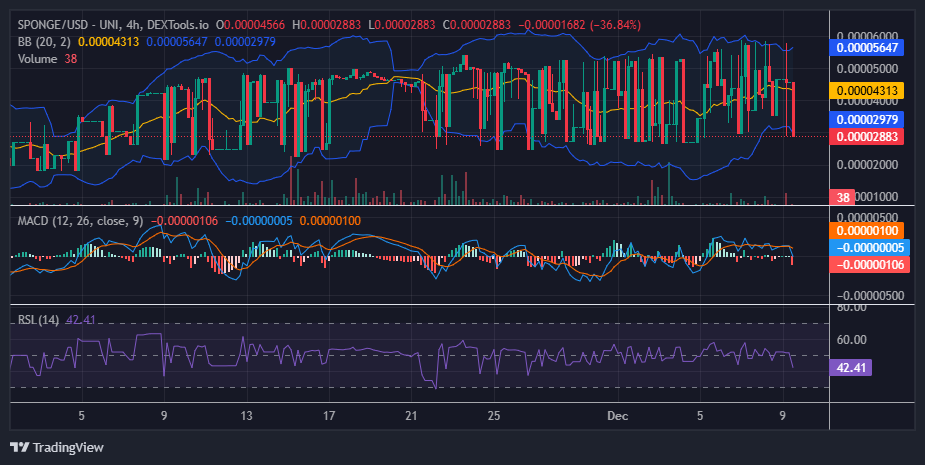
$SPONGE (SPONGE/USD) Technical Outlook
The recent price action suggests a potential uptrend, characterized by higher lows. The Bollinger Bands, which measure market volatility, have been narrowing, indicating a potential period of decreased price swings.
However, it’s important to note that the SPONGE/USD market is currently consolidating after reaching a recent peak near $0.000057. The Relative Strength Index (RSI) and Moving Average Convergence Divergence (MACD) suggest a period of indecision, with buyers and sellers battling for control.
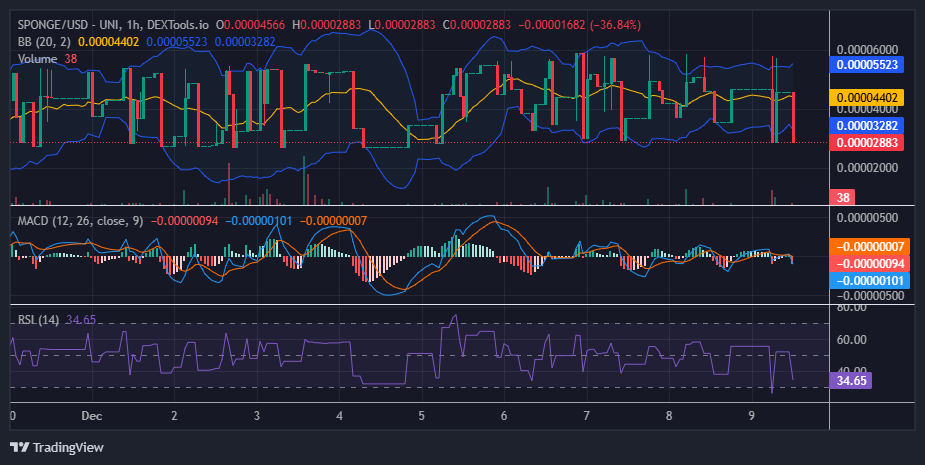
$SPONGE (SPONGE/USD) 1-Hour Chart Insights
The 1-hour chart shows a sideways trend, with the price oscillating within a well-defined range. The Bollinger Bands are relatively wide, indicating increased volatility. While the recent price action has been characterized by upper wicks, suggesting selling pressure, the underlying bullish sentiment suggests that a breakout above the resistance level could lead to further upward momentum.
Join the SPONGE community and be part of the next big crypto sensation! Buy Sponge ($SPONGE) today!