$SPONGE (SPONGE/USD): Can Bulls Bounce Back From Bearish Jabs?
Estimated Reading Time: 2 minutes
Don’t invest unless you’re prepared to lose all the money you invest. This is a high-risk investment and you are unlikely to be protected if something goes wrong. Take 2 minutes to learn more

Despite the appearance of a hammer candlestick in the last analysis of the $SPONGE market, the market has failed to establish a rally, returning to approximately the $0.00005 price level. This new development suggests a bearish trajectory, as indicators are now also showing bearish sentiment. After a prolonged period of uncertainty, the market is now moving in a clear direction. This dip in price may encourage traders to buy, potentially triggering another rally.
Key Market Dynamics:
- Resistance Levels: $0.0010, $0.0011, and $0.0012
- Support Levels: $0.000035, $0.000030, and $0.000025

$SPONGE (SPONGE/USD) Technical Outlook
The indicators used in this analysis are now exhibiting a bearish sentiment. The Bollinger Bands, while still indicating high market volatility through their substantial bandwidth, have begun to move downward. The Moving Average Convergence and Divergence (MACD) indicator also shows a strong bearish signal, with the two MACD lines aggressively moving downward and strong histograms. However, the Relative Strength Index (RSI) does not yet indicate an oversold market. This raises the concern that the market may still appear to be ranging sideways due to this indication.
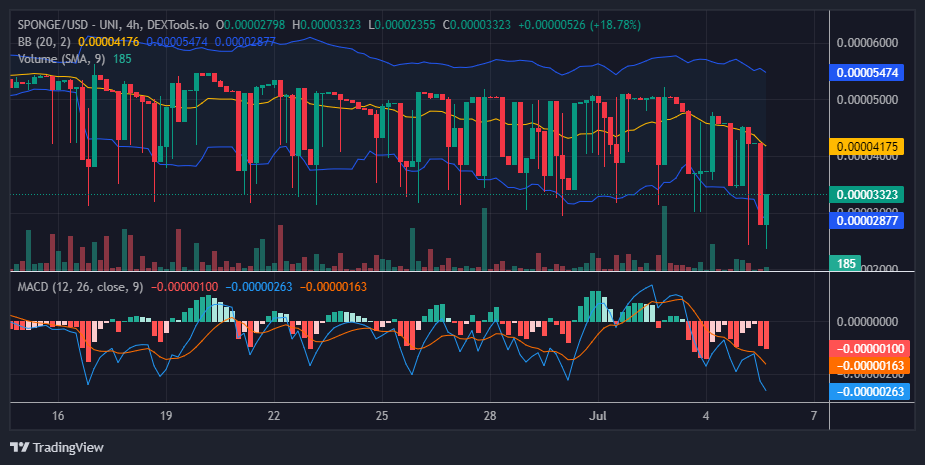
SPONGE/USD 1-Hour Chart Insights
Zooming in on the 1-hour chart, the market clearly shows a downward trend, with lower peaks becoming evident from this perspective. The newly identified support level is $0.0000243, raising the question of whether the bulls can overcome the nearby resistance level. However, recent candlesticks present two bullish arrows, indicating potential bullish activity aimed at recovery. This suggests that the bulls may be working effectively to surpass the nearby resistance level and prevent further market decline.
Buy SPONGE/USD!
History teachers in 2050 be like:$SPONGE was inevitable 🧽🚀 pic.twitter.com/3zQJZFwRm2
— $SPONGE (@spongeoneth) June 24, 2024
Invest in the hottest and best meme coin. Buy Sponge ($SPONGE) today!