$SPONGE (SPONGE/USD): Can Bulls Keep Control as Price Faces Resistance
Estimated Reading Time: 3 minutes
Don’t invest unless you’re prepared to lose all the money you invest. This is a high-risk investment and you are unlikely to be protected if something goes wrong. Take 2 minutes to learn more

For weeks, a tug-of-war has unfolded between bulls and bears in the $SPONGE market. However, we are now observing the bulls gradually gaining the upper hand, leading to a slight shift in price towards the upside, albeit by a marginal difference. Initially, the bears took charge, driving prices downward. However, the bulls stood their ground, establishing a defensive line at a critical midpoint.
This resilience became apparent through the formation of “higher lows,” with each dip met by a swift response from the bulls, demonstrating their steadfast presence below the $0.00004 price threshold.
Currently, a shift in the market dynamic is underway. The price action deviates from the previous equilibrium, indicating that the bulls are seizing control. They are maintaining the potential for the trend to continue in the upward direction.
Key Market Dynamics:
- Resistance Levels: $0.0010, $0.0011, and $0.0012.
- Support Levels: $0.000035, $0.000030, and $0.000025.
Delving into Technical Analysis for $SPONGE (SPONGE/USD)
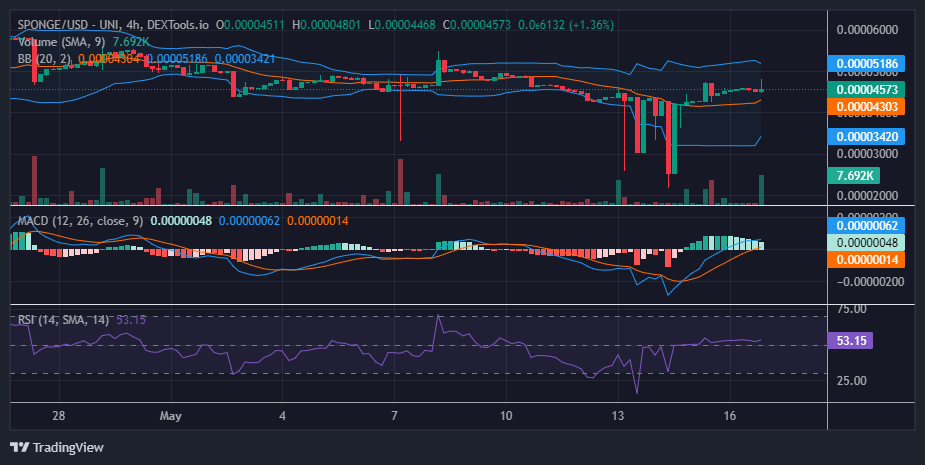
Technical indicators on the 4-hour chart depict a gradual dominance by bulls. Previously, we observed a bullish crossover in the MACD, with both lines continuing their upward trajectory. Presently, the MACD lines have crossed above the 20-day moving average, further confirming the market’s upward momentum. However, the faded green histograms indicate a resurgence of bearish pressure, signaling bearish resistance.
Additionally, the Bollinger Bands, which previously exhibited a wide bandwidth, are now displaying a sharp contraction. This suggests a significant decrease in the $SPONGE market volatility, likely due to an intense struggle between supply and demand. Typically, such a convergence of bands may signal a potential bullish breakout. However, the appearance of an inverted hammer, accompanied by a substantial volume of trade histograms supporting the current session, indicates that more bullish strength may be necessary to avert a potential bearish reversal.

Insights from the 1-Hour Perspective
The 1-hour chart reveals a nuanced battle, with bulls currently holding the upper hand while the bears have not been entirely subdued. This “nuanced bullish trend” indicates that bulls are striving to advance, potentially encroaching upon bearish territory. However, formidable resistance may prompt a retreat towards the key support level of $0.000042.
Despite the bullish persistence, we must not overlook the current crypto signal from the 1-hour chart. The last two sessions underscore strong bearish resistance, particularly evident in the appearance of two candlesticks with significant upper shadows, suggesting the possibility of a retracement. However, if bulls can maintain their stance and prevent a price drop, there’s a chance they could reclaim $0.00005 as a support level, further solidifying their position.
King Charles has given his approval.
King Charles approves 👏 🧽 $SPONGE #SpongeV2 #100x pic.twitter.com/j9Zy4RsJnZ
— $SPONGE (@spongeoneth) May 16, 2024
Invest in the hottest and best meme coin. Buy Sponge ($SPONGE) today!