$SPONGE (SPONGE/USD) Faces Key Resistance at $0.000038
Estimated Reading Time: 3 minutes
Don’t invest unless you’re prepared to lose all the money you invest. This is a high-risk investment and you are unlikely to be protected if something goes wrong. Take 2 minutes to learn more

The $SPONGE market is currently consolidating around the $0.000038 level, a price range it has tested multiple times. Persistent bearish pressure near the $0.00004 resistance has created a tense standoff between buyers and sellers, though bullish sentiment remains intact.
An analysis of the 4-hour chart reveals a recent dip toward the $0.0000006 support level, which was swiftly met with renewed buying interest. This indicates that some traders are actively accumulating at lower prices. However, despite this rebound, the $0.00004 resistance remains a major hurdle to further upward movement.
Key Price Levels:
- Resistance: $0.000040, $0.000045, $0.000050
- Support: $0.000019, $0.000018, $0.000017
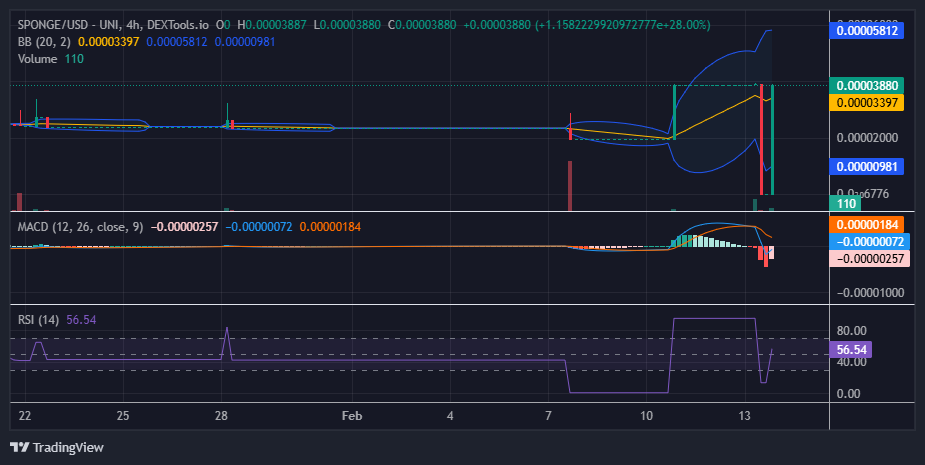
SPONGE/USD Technical Analysis
The $0.000039 price zone has emerged as a critical resistance point, with bullish breakout attempts repeatedly meeting rejection near the $0.00004 threshold. The MACD indicator reflects this struggle, displaying strong negative histograms and a sharp decline as the faster MACD line dropped below the zero level.
However, bearish control was short-lived, as the faster MACD line quickly rebounded, retracing toward the slower line. This shift is evident in the diminishing histogram size, signaling weakening bearish momentum. As the $SPONGE traders rushed to “buy the dip,” the market saw a rapid recovery, mirroring the prior decline.
If bullish momentum holds, a breakout above $0.00004 could be imminent. Sustained buying pressure in the coming sessions may drive the price toward higher resistance levels.
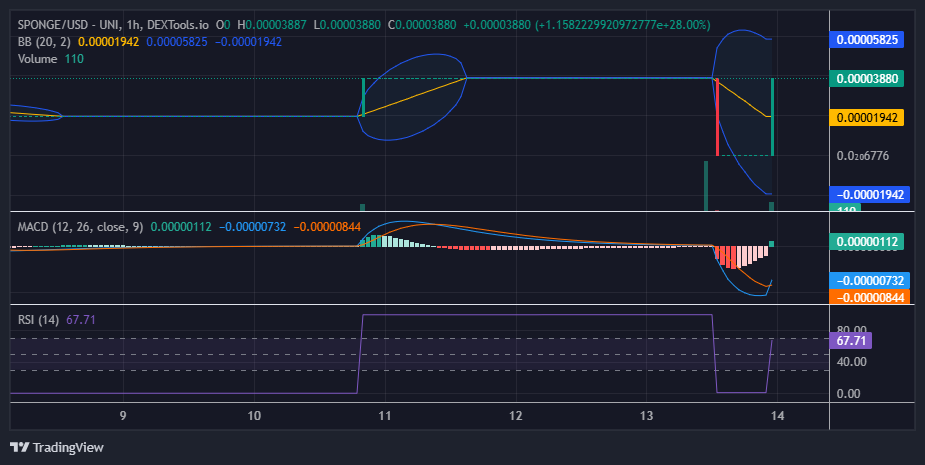
$SPONGE 1-Hour Chart Insights
On the 1-hour chart, the MACD indicator suggests a market in transition. The shrinking red histograms indicate fading bearish strength, though caution remains as price action nears the $0.000039 resistance—a level that has consistently rejected upward movement. The smaller volume accompanying recent bullish candlesticks reflects hesitancy among traders.
A decisive break above $0.000039, supported by increasing buying volume, could pave the way for a stronger bullish trend. However, if bulls fail to breach this level, the market may consolidate further or face renewed selling pressure.
Buy $SPONGE!
First bull cycle, anon? pic.twitter.com/eToKZaMQdI
— $SPONGE (@spongeoneth) February 14, 2025
Join the SPONGE community and be part of the next big crypto sensation! Buy Sponge ($SPONGE) today!


