$SPONGE (SPONGE/USD) Finds Itself Amidst the Intriguing Dance of a Potential Price Rally
Estimated Reading Time: 3 minutes
Don’t invest unless you’re prepared to lose all the money you invest. This is a high-risk investment and you are unlikely to be protected if something goes wrong. Take 2 minutes to learn more

In the latest scrutiny of the $SPONGE market, a tapestry of developments hints at a response from bullish traders, a counterpoint to the preceding bearish undertow. Following the sighting of a formidable bearish marubozu candlestick in preceding trading sessions, there has emerged a discernible uptick in bullish fervor. Yet, the bullish surge is tempered, ensnared by the persistent presence of bears around the $0.00007 threshold. The reluctance of bulls to breach this frontier seems to persist into the current trading day, fostering a milieu of market consolidation hovering at $0.00005.
Key Market Dynamics:
- Resistance Levels: $0.0010, $0.0011, and $0.0012.
- Support Levels: $0.000035, $0.000030, and $0.000025.
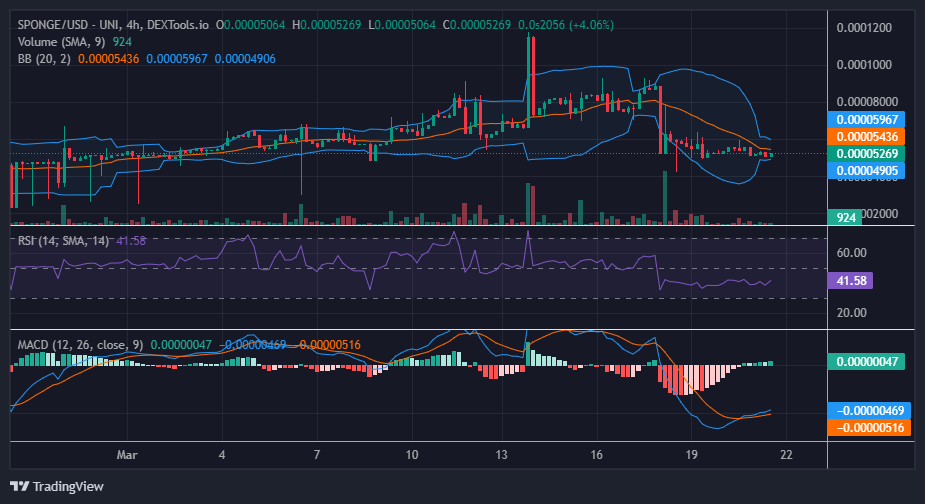
Delving into Technical Analysis for $SPONGE (SPONGE/USD):
The significant Marubozu candlestick suggests substantial trading activity driven by a limited number of participants, as the session lacked substantial volume in the trade histogram to support it. This suggests that the bearish movement might not have a lasting impact. Indeed, the $SPONGE bearish trend did not persist; bulls intervened at the $0.00005 price level, and there was substantial volume in the trade histogram to support this reversal. However, even though a significant bullish price action was anticipated, it did not materialize due to resistance at $0.00006. This led to sideways movement in the market as the price action struggled to break above this level, resulting in a range-bound scenario. Consequently, the price action remains confined within a range. Recent crypto signals, such as the convergence of the Bollinger Bands, may suggest an impending price movement; however, further confirmation is required.
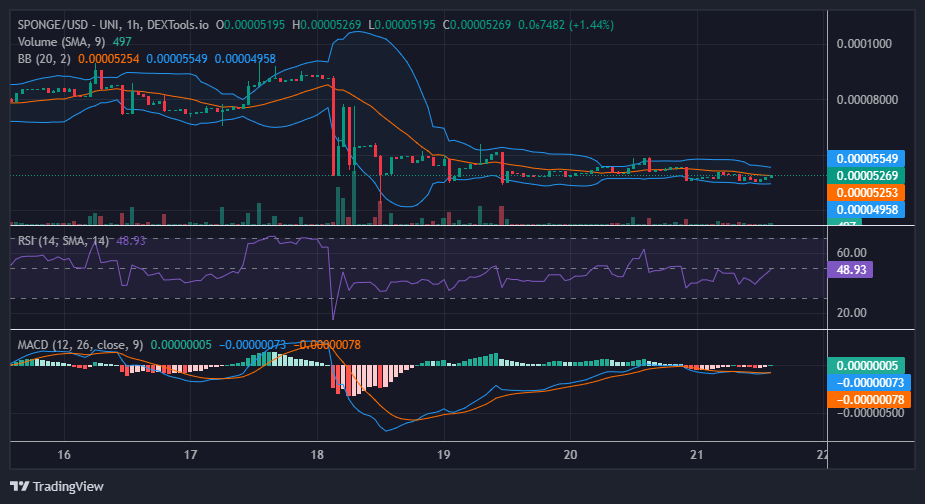
Insights from the 1-Hour Perspective:
In the previous analysis, as observed in the 1-hour chart outlook, it was noted that the two MACD lines began to approach a potential crossover above the zero level. However, with the market persistently failing to breach the $0.00006 price level, it continues to exhibit sideways movement. Consequently, the two MACD lines converge and maintain a sideways trajectory, indicating a standoff between demand and supply. Considering the historical significance of the $0.00005 price level in relation to bullish activities, it is reasonable to anticipate a breakout beyond the $0.00006 barrier in due course.
Buy SPONGE/USD!
Sheeeshhhh $SPONGE flexing hard#SpongeV2 #100x #AltSeason pic.twitter.com/5VIxCKmiwE
— $SPONGE (@spongeoneth) March 21, 2024
Invest in the hottest and best meme coin. Buy Sponge ($SPONGE) today!