Bitcoin Cash (BCH/USD) Market Dumps Significantly into a Lower Zone
Estimated Reading Time: 3 minutes
Don’t invest unless you’re prepared to lose all the money you invest. This is a high-risk investment and you are unlikely to be protected if something goes wrong. Take 2 minutes to learn more

Free Crypto Signals Channel
Bitcoin Cash Price Prediction – May 6
To an extent, the BCH/USD market dumps significantly into a lower zone. In the last several hours, the crypto-economic price trades between $277 and $270 value lines at an average of 1.61% negatives.
BCH/USD Market
Key Levels:
Resistance levels: $300, $350, $400
Support levels: $250, $200, $150
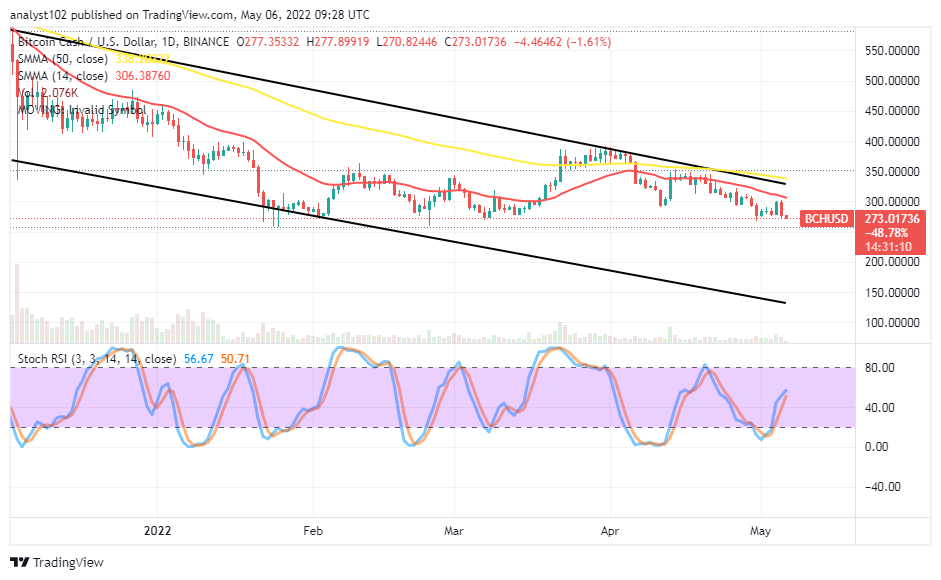
BCH/USD – Daily Chart
The BCH/USD daily chart showcases the crypto-economic market dumps significantly into a lower zone. The 50-day SMA indicator is above the 14-day SMA indicator. And they are pointing toward the south direction to signify the crypto business operations are bargaining under depressions over time until the present. The Stochastic Oscillators have sprung northbound briefly against the range of 40, seemingly trying to bend backward around the 60 range line.
Will the BCH/USD lowers for a long time under the $300 as the market dumps significantly into a lower zone?
The downward trading cycle in the BCH/USD trade operations is still on course as the crypto-economic market dumps significantly into a lower zone beneath the $300 resistance level. Price has every tendency of downing further toward the $250 support in the near time to allow long-position lacers a better stance to make a come-back afterward. Observantly, good buying entry will be around the support line mentioned in the near possible period.
On the downside of the technical analysis, the BCH/USD market short-position takers have to focus their purchasing weight around the 14-day SMA trend line to get a psychological resistance point capable of leading price to variant rejections. The current emergence of a bearish candlestick around the $300 will probably lead to depreciation in the BCH’s valuation against the USD Dollar’s worth.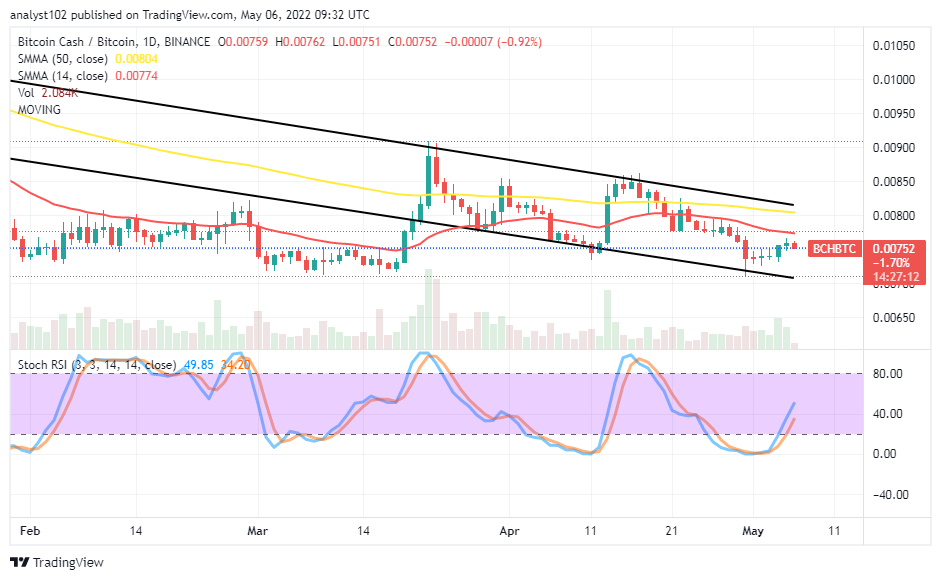
BCH/BTC Price Analysis
Comparing the trending capacity of Bitcoin Cash to Bitcoin, the base crypto is still under a selling force, trading against the flagship countering crypto. The cryptocurrency pair market dumps underneath the SMA trend lines. The 50-day SMA indicator is above the 14-day SMA indicator, affirming the continual downing movement process in the pairing trading instruments. The Stochastic Oscillators have crossed northbound from the oversold region to the range of 40. A bearish candlestick is trying to surface closely beneath the smaller SMA. That shows the counter crypto economy is gaining a pushing-power capacity at the expense of the base weaknesses.
Note: Cryptosignals.org is not a financial advisor. Do your research before investing your funds in any financial asset or presented product or event. We are not responsible for your investing results.
You can purchase Lucky Block here. Buy LBlock: