$SPONGE (SPONGE/USD): Holding the Line at $0.0001 – Is a Bullish Eruption Imminent?
Estimated Reading Time: 3 minutes
Don’t invest unless you’re prepared to lose all the money you invest. This is a high-risk investment and you are unlikely to be protected if something goes wrong. Take 2 minutes to learn more

$SPONGE is currently showcasing remarkable resilience, anchoring itself just above the pivotal $0.0001 support. Despite a lull in significant price fluctuations, this steadfast holding pattern suggests a strong defense by bullish participants. The extended period of sideways trading in close proximity to this critical support level hints at an accumulation of bullish pressure, making a downward slide appear increasingly improbable while simultaneously amplifying the potential for a significant upward thrust.
Keep an Eye on These Key Price Boundaries:
- Resistance: $0.000110, $0.000120, $0.000130
- Support: $0.000090, $0.000085, $0.000080

Daily SPONGE/USD Perspective: A Silent Accumulation Before a Possible Pricequake
The daily chart for $SPONGE over the last 24 hours paints a picture of market indecision around the $0.0001 mark, further solidifying this level as a robust foundation of support. The 20-day moving average is now running flat along this trading range, mirroring the current market equilibrium. Interestingly, the Bollinger Bands maintain a moderate width, suggesting that the energy from previous volatility hasn’t entirely dissipated and that a substantial price movement could be on the cards.
While immediate momentum might seem lacking, the underlying technical structure in this crypto signal favors the bulls. Should a breakout materialize, the prolonged period of consolidation suggests it could be a rapid and decisive move upwards.
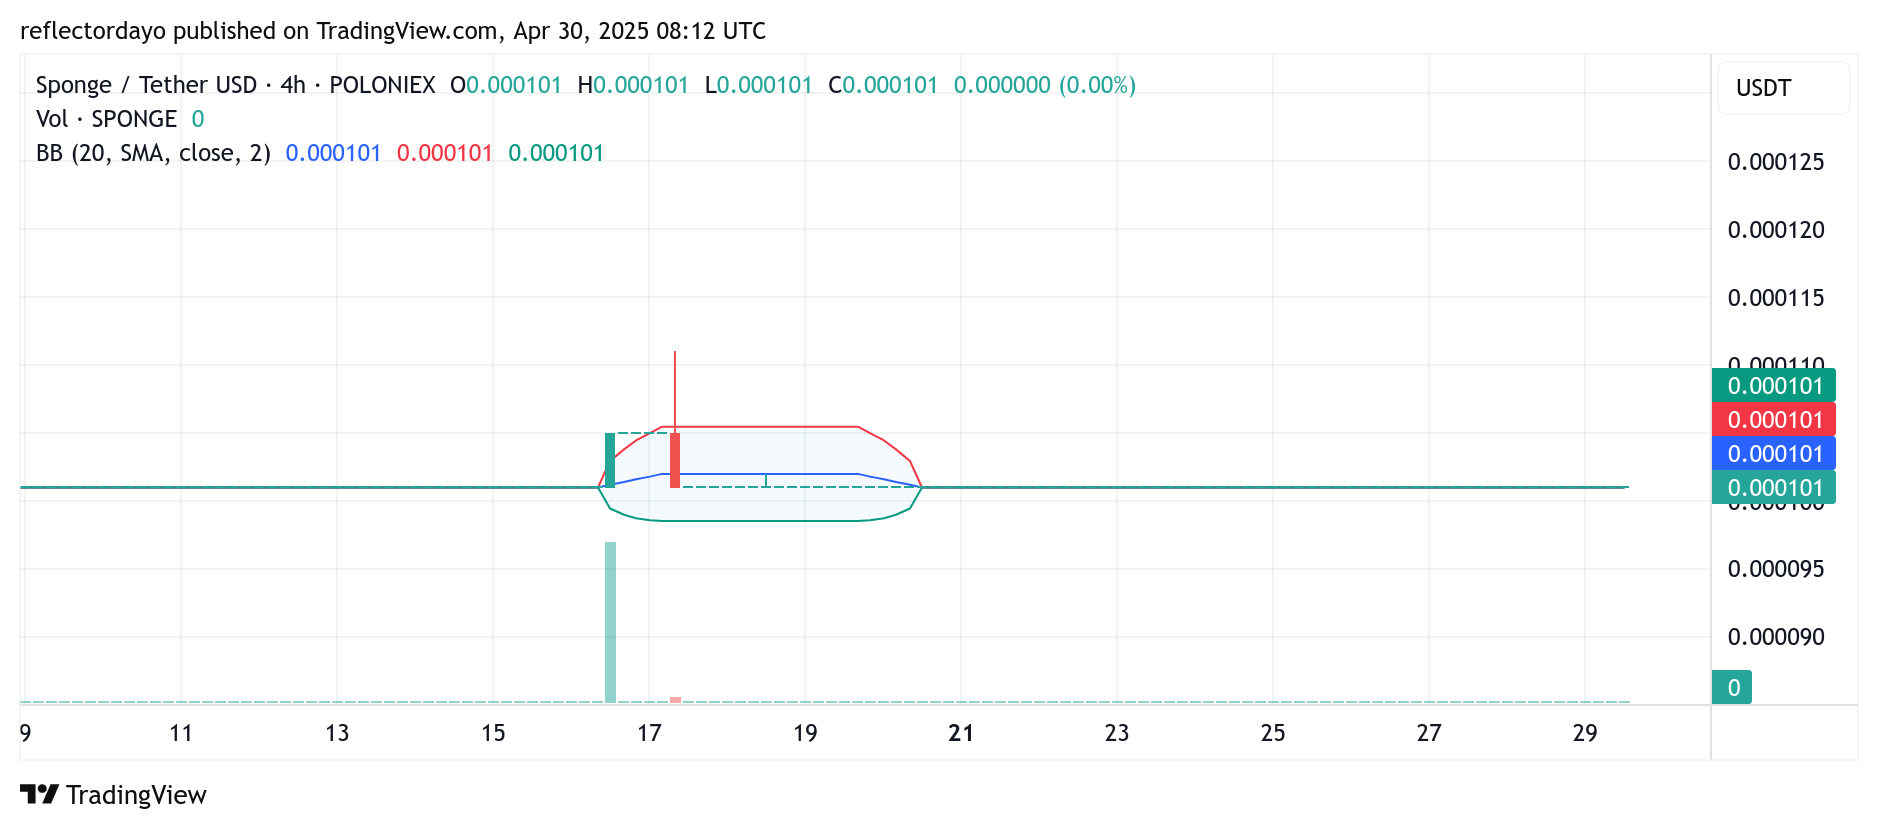
4-Hour $SPONGE Deep Dive: A Volatility Coil Pointing Towards an Upside Break
Taking a closer look at the 4-hour chart reveals a compelling scenario. The Bollinger Bands are undergoing a significant squeeze, a classic technical signal that often precedes a major breakout in price. With various indicators converging and the price exhibiting steadfastness above key support, this setup strongly suggests an impending bullish surge. For traders seeking to capitalize on early moves, this could be an opportune moment to position themselves ahead of a potential rally.
Buy $SPONGE/USD
HODLING through the noise pic.twitter.com/g7fN7pKX0l
— $SPONGE (@spongeoneth) April 28, 2025
Join the SPONGE community and get in on the next big crypto opportunity! Buy Sponge ($SPONGE) today