$SPONGE (SPONGE/USD) Makes a Splash After Dipping Below $0.000050
Estimated Reading Time: 2 minutes
Don’t invest unless you’re prepared to lose all the money you invest. This is a high-risk investment and you are unlikely to be protected if something goes wrong. Take 2 minutes to learn more

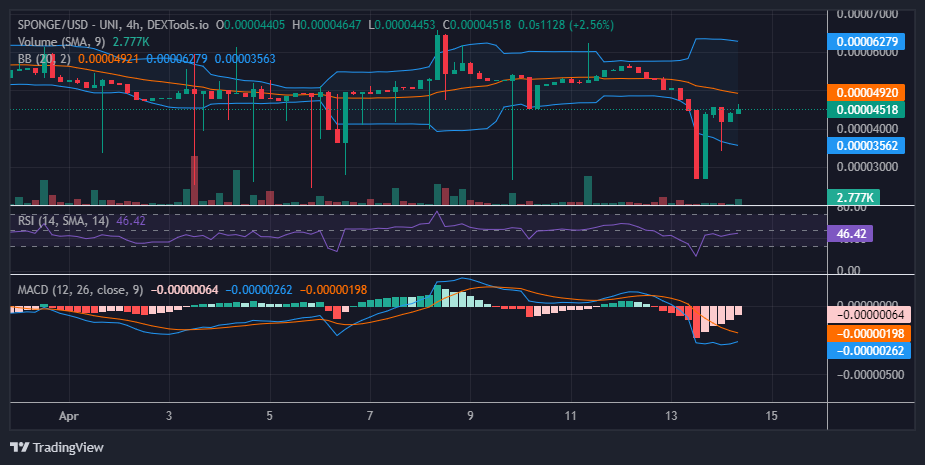
The general cryptocurrency market has been experiencing rough waves lately, and the $SPONGE market has had its own fair share of the experience. Prices took a dive, breaching the $0.000050 mark (after a while of consolidating or ranging sideways along the level) and even sinking lower than $0.000030. But just like a sponge absorbing water, SPONGE found support, absorbing the sell-off as it bounced back up towards $0.000050. Currently, it’s hovering around $0.000045.
Key Market Dynamics:
- Resistance Levels: $0.0010, $0.0011, and $0.0012.
- Support Levels: $0.000035, $0.000030, and $0.000025.
Delving into Technical Analysis for $SPONGE (SPONGE/USD):
SPONGE/USD is in a recovery phase, but it’s facing resistance at $0.000045 because bears have now occupied this level for a resistance. Indicators like the RSI (measuring buying and selling pressure) and MACD (analyzing momentum) suggest a balanced market. The RSI is around 46, indicating neither buyers nor sellers are in full control. The MACD shows some bullish crypto signals, hinting at a possible comeback. Fading red bars on the MACD suggest selling pressure is easing, potentially paving the way for a bullish surge. The main hurdle to overcome is the resistance at $0.000045.
Insights from the 1-Hour Perspective:
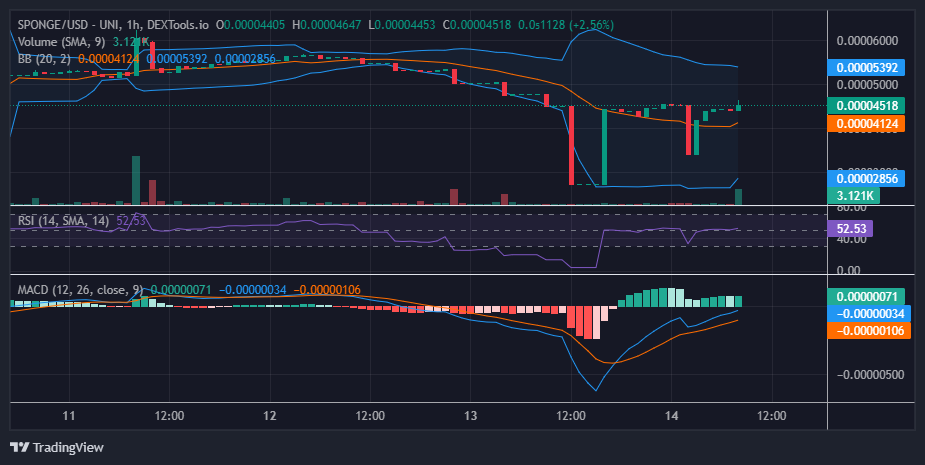
Looking at the 1-hour chart, the Bollinger Bands paint an interesting picture. The bands have been wide, reflecting significant price swings between $0.000030 and $0.000045. However, as the price steadies around $0.000045, the bands are starting to narrow, suggesting less volatility. Reclaiming this level is crucial for the bulls to turn the tide and push the price back towards $0.000050.
Buy SPONGE/USD!
Stake your $SPONGE, or else… 🧽#SpongeV2 #MemeCoin #Halving pic.twitter.com/VAmdiLKHZ7
— $SPONGE (@spongeoneth) April 12, 2024
Invest in the hottest and best meme coin. Buy Sponge ($SPONGE) today!